2 Information necessary to track progress made in implementing and achieving NDCs
2.1 National circumstances and institutional profile
2.1.1 National circumstances
Below, information is reported on national circumstances relevant to progress made in implementing and achieving Norway’s NDC under Article 4 of the Paris Agreement and how national circumstances affect GHG emissions and removals over time.
Government structure
Norway is a constitutional monarchy with a democratic parliamentary system of governance. The current Government (the Støre Government) took power in October 2021. It is a minority coalition between the Labour Party and the Centre Party. The Storting (Norwegian parliament) determines Norway’s overall climate policy, and the government implements and administers the policies and measures.
Although it is not a member of the EU, Norway has, since 1994, been part of the European Union’s internal market through the Agreement on the European Economic Area (EEA Agreement). The objective of the EEA Agreement is to strengthen trade and economic relations between the EEA/EFTA States and the EU Member States, based on a level playing field throughout the EEA. The Agreement gives the EFTA countries opportunities to influence EU policy making also in areas of relevance to the internal market, including environmental policies. A practical implication of the EEA agreement is that Norway adopts the same legislation as EU where relevant. Details on legislation relevant to climate change are given in chapter 2.5.
Population profile
With a total area of almost 324,000 km2 and only 5.5 million inhabitants, Norway has the lowest population density in Europe after Iceland and Russia. The large majority of the Norwegian population is settled along the coast and the fjords, and an increasing percentage, at present about 80 per cent of the population, lives in urban settlements. Most of the urban settlements are small and have under 20,000 inhabitants. Only six areas – Oslo, Bergen, Stavanger/Sandnes, Trondheim, Fredrikstad/Sarpsborg and Drammen – have more than 100,000 residents. More than a third of Norway’s population lives in the six largest city areas. Population has grown from 4.2 million in 1990 to 5.5 million in 2023, about 31 per cent.
Geographical profile
The mainland of Norway is 1,752 km from north to south, spanning about 13 degrees of latitude. The total area of the mainland is 323,781 km2. In addition, the Norwegian continental shelf is 2,039,951 km2. The mainland coastline is more than 2,500 km long, excluding fjords and bays. In the east, Norway shares borders with Sweden, Finland and Russia. In addition, the Arctic archipelago of Svalbard is under Norwegian jurisdiction. Except for the LULUCF sector, the inventory includes emissions on the archipelago Svalbard as well as on mainland Norway. In particular, emissions from coal mining on Svalbard are included.
The long and narrow shape of Norway is accompanied by wide variations in climate, geology and topography. This gives large variation in conditions for land use. Only about 30 per cent of the land area is lowland below 300 meters, and this is where most people live and where agricultural production is most prominent. As much as 20 per cent of the land area is mountainous areas more than 900 meters above sea level. Cultivated land account for only 3 per cent of the mainland, while about 37 per cent is covered by forest. The remaining area consists of other cultivated and developed land, scrub, and heath along the coast, mountain forest and marginal forest, and sparsely vegetated mountains and mountain plateaus. About 46 per cent of the land is above the tree line. Currently, 25.7 per cent of the land area including Svalbard and Jan Mayen is protected under the Nature Conservation Act and the Svalbard Environmental Act. Of the Norwegian mainland, 17.6 per cent is protected. Nevertheless, the proportion of wilderness-like areas, defined as areas more than 5 km from major infrastructure development, has been reduced dramatically from about 48 per cent of the land area in 1900 to about 11.2 per cent today. From 1988 to 2023 this area was reduced with about 2890 km2. Only about 5 per cent of the area of southern Norway is characterised as wilderness-like.
Economical profile
Norway is a small, open economy. In 2023, exports constituted about 47 per cent of GDP. Together with foreign shipping, the production of crude oil and natural gas account for about a fourth of GDP in Norway, but only a small proportion of employment, see Table 2.1. Around 30 per cent of the workforce are employed in the public sector.
Tabell 2.1 GDP and employment in 2023
GDP (2023 prices, million NOK)
Share of Total GDP
Employment (1000 persons)
Share of total employment
Norway
4,643.1
1.00
2,968.1
1.00
Mainland Norway
3,420.2
0.74
2,923.6
0.98
Public sector
841.5
0.18
889.5
0.301
Oil and gas extraction2 and foreign shipping
1,222.9
0.26
44.5
0.02
1Share of the employment in mainland Norway
2Including transport via pipelines
Source: Statistics Norway
Norway has greatly benefitted from cross-border trade and investments. Globalisation facilitates access to financing, capital and labour inputs, export markets, technological transfers, and increases competition. The result is a more efficient use of available resources, which has contributed to strong global growth during the past decades. Norway has for a long time benefitted from rising export prices and falling import prices. However, the Norwegian krone has weakened in recent years. This depreciation has increased profitability in export-oriented industries, but at the same time it contributes to higher import prices and costs for households and businesses that purchase goods and services from abroad.
High price growth, combined with higher interest rates to combat inflation, has reduced the growth in activity in the Norwegian economy. Growth is now lower than the initial period following the global Covid-19 pandemic. The labour market is however still characterized by high demand for labour and the unemployment is low.
The petroleum industry remains important for the Norwegian economy for years to come, but as share of GDP it is expected to decline as remaining resources are depleted.
A continually stricter global climate policy and an ever faster technological development changes the overall conditions for Norwegian business. Norway’s ambitious climate goals require higher growth and new jobs in less carbon-intensive sectors. The strategy for green competitiveness sets the direction for this change.
The emissions for 2023 were published by Statistics Norway in November 2024. The numbers for 2023, that have not yet been reported to the UNFCCC, show that Norway’s emissions totalled 46.7 million tonnes of CO2 equivalents, excluding LULUCF. This is a decrease of 9.1 per cent since 1990, and a 4.7 per cent decrease from 2022 levels.
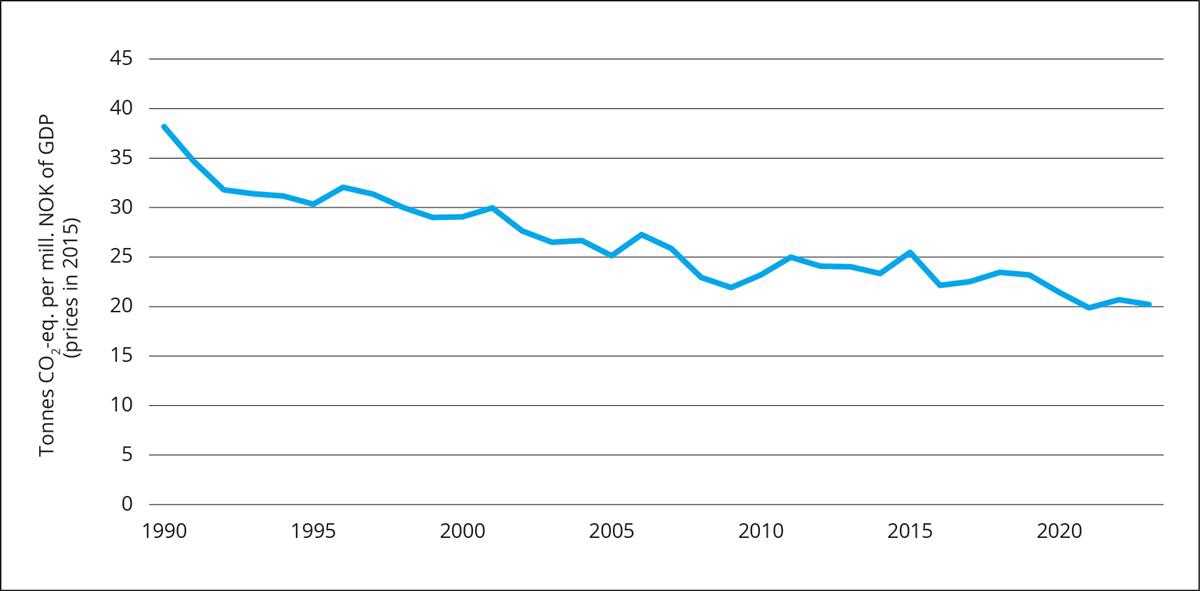
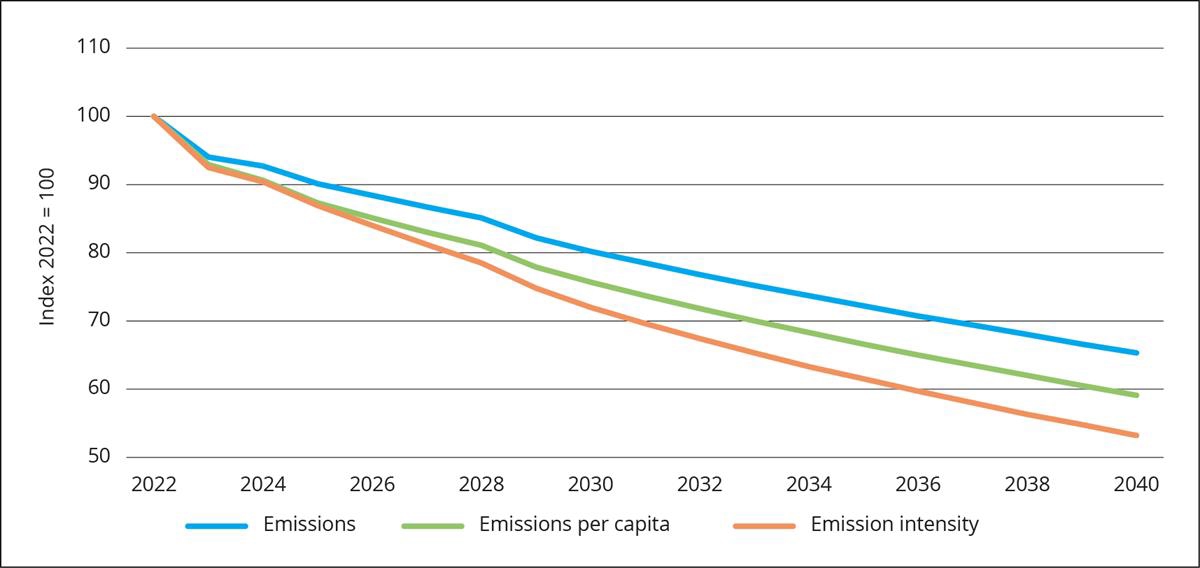
Emission intensity fell by 56 per cent from 1990 to 2022 (see Figure 2.1). Emission intensity does not include inflation. Greenhouse gas emissions relative to GDP normally decline as scarce resources are utilised more efficiently. Use of taxes or quotas on emissions, resulting in higher energy costs, reinforce this trend. Norway introduced a CO2 tax as early as 1991. This tax has subsequently been supplemented by the participation of Norwegian installations in the EU’s emissions trading system. About 85 per cent of all greenhouse gas emissions in Norway are subject to economic instruments. The use of economic instruments has contributed to the significant decline in emission intensity.
Figur 2.1 Emission intensity in Norway
Source: Statistics Norway
Climate profile
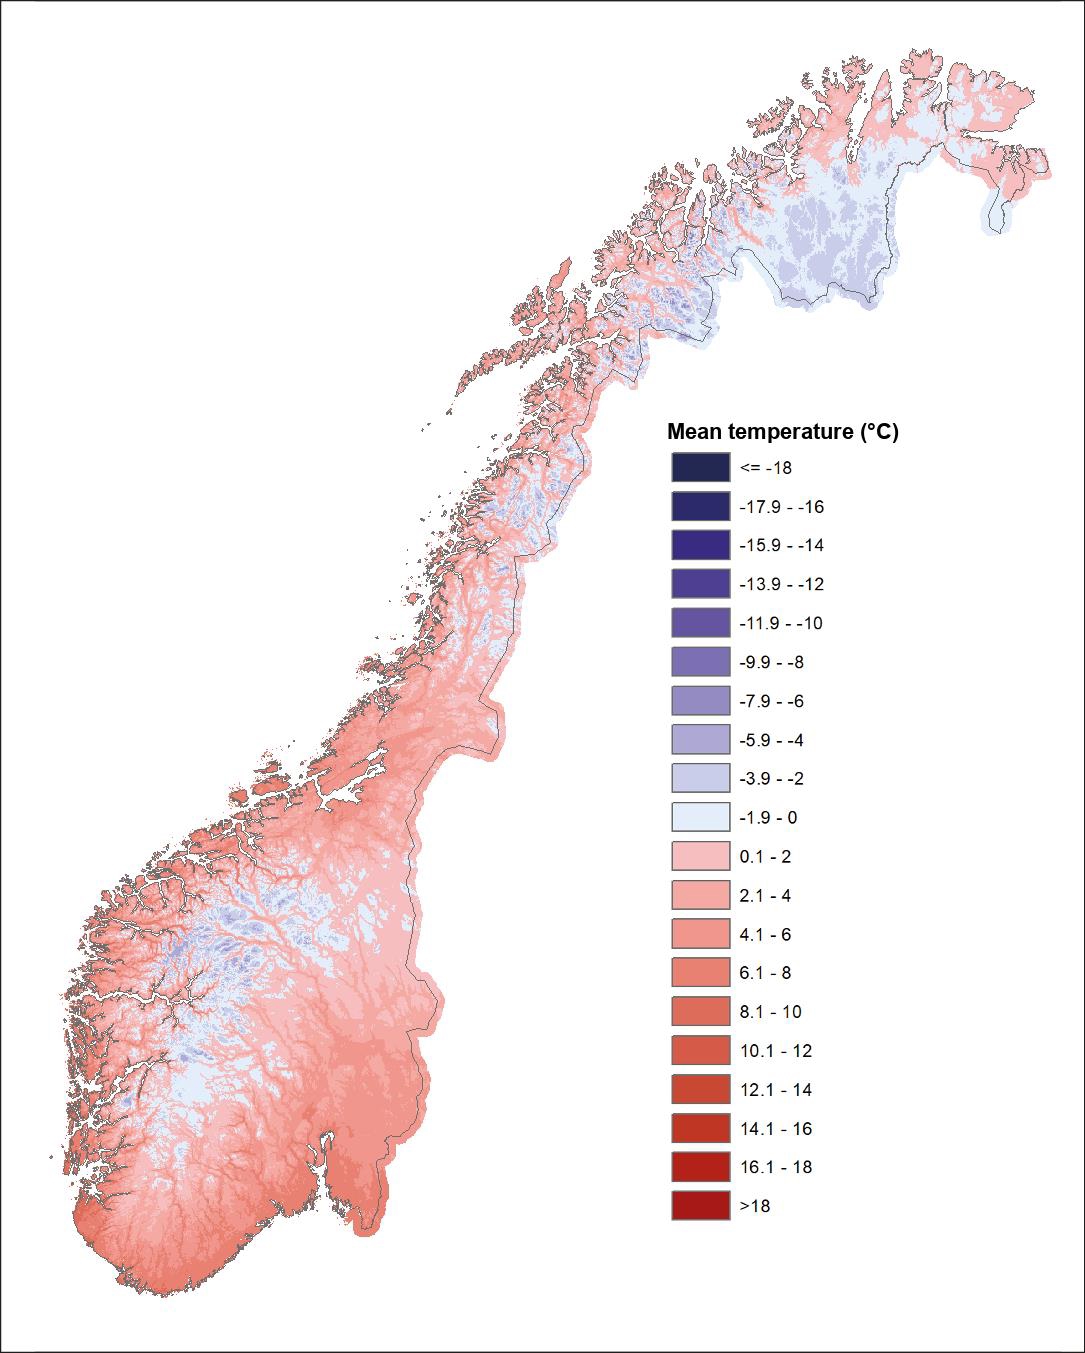
Because of the influence of the North Atlantic Ocean, Norway has a much warmer climate than its latitudinal position would indicate. Therefore, most of Norway has a maritime climate with relatively mild winters and cool summers. On an annual basis, the highest normal (1991–2020) annual air temperatures, (up to 8.6°C) are found along the south-western coast (see Figure 2.2). Outside the mountain regions, the lowest annual mean temperatures (down to -1.9°C) are found on the Finnmark Plateau. During winter, the coast from Lindesnes to Lofoten has normal monthly mean temperatures above 0°C. The absolute lowest and highest temperatures measured at official weather stations on the mainland are -51.4°C and +35.6°C, respectively.
In the cool Norwegian climate, there is a substantial need for heating of buildings. The «heating degree days» (defined as the number of degrees the daily mean temperature is below 17 °C, added up for every day of the year) for the 1991-2020 period was between 3,000–4,000 in the coastal lowland areas. In the northernmost parts of Norway, the value can be up to 7,000.
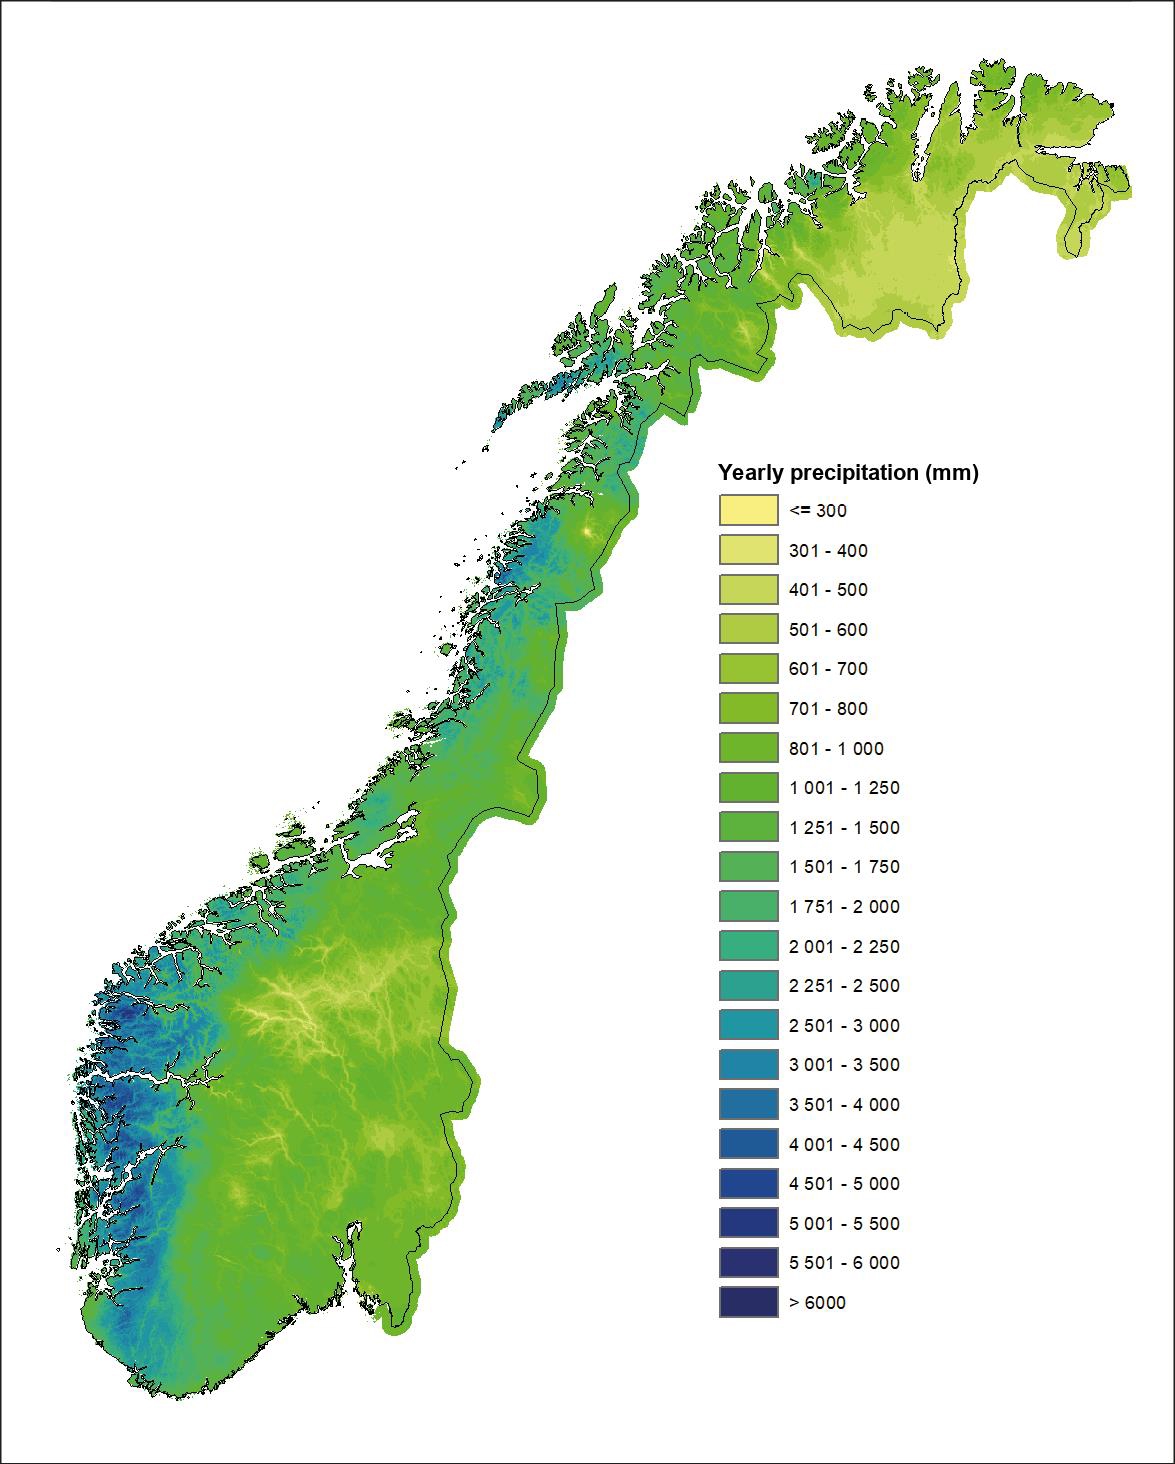
Because of prevailing westerly winds, moist air masses flow regularly in from the ocean giving abundant precipitation over most of Norway. Areas just inland of the coast of western Norway get the most precipitation (see Figure 2.3). This zone of maximum precipitation is one of the wettest in Europe, and several sites in this region have normal annual precipitation of more than 3,500 mm. On the leeward side of the mountain ranges, the annual precipitation is much lower, and a few sheltered stations in the inland areas of south-eastern Norway and one station in Nordland have normal annual precipitation less than 350 mm.
Figur 2.2 Normal annual temperature in Norway 1991–2020
Source: Norwegian Meteorological Institute
Figur 2.3 Normal annual precipitation in Norway 1991–2020
Source: Norwegian Meteorological Institute
2.1.2 Sector details
Energy
Energy use and electricity production
Nearly all of Norway’s electricity production is based on renewable energy sources, and the proportion of energy use accounted for by electricity is considerably higher than in most other countries.
Norway has a large energy-intensive manufacturing sector, and electricity is more widely used to heat buildings and water than in most other countries. Because renewable energy is the main source of energy usage, greenhouse gas emissions associated with stationary energy use are low in Mainland-Norway.7
Emissions to air from energy use are therefore mainly concentrated in manufacturing, transportation, construction, and agriculture where the use of fossil fuels is still widespread. Emissions to air from offshore petroleum activities largely originate from the combustion of natural gas and diesel in turbines, engines and boilers, flaring of natural gas for safety reasons, venting and diffuse emissions of gas, and storage and loading of crude oil.
Important drivers of energy use
There are various factors that influence the energy usage in Norway. Variations in energy use from year to year are often related to fluctuations in weather conditions and in the prices of energy and energy-intensive goods and services. Longer-term trends are related to population growth and other demographic factors, industrial structure and to the rate of economic growth and structural changes in the economy.
Norway’s population has grown about 31 per cent from 1990 to 2023. Strong economic growth has resulted in a tripled GDP since 1990. Both demand for goods and services that use energy are growing steadily. However, final energy consumption has risen by only 14 per cent, demonstrating that the Norwegian economy gradually has become less energy-intensive.
Norway has a national target to improve energy intensity in the mainland economy by 30 per cent from 2015 until 2030. The Ministry of Energy reports every year on the development in energy intensity in the state budget. In 2023 the government presented an action plan for energy efficiency, presenting several instruments that will contribute to more energy efficiency, including legal requirements and targeted information measures.
Energy usage, by sector
Energy use in absolute numbers is highest in the manufacturing and transport sectors, followed by households and services. Other sectors such as construction, agriculture, and fisheries account for only a small proportion of energy use. Energy use has increased since 1990, with most of the increase taking place before 2000. In 2023, the final energy consumption was about 217 TWh (Statistics Norway).
Electricity is the dominant energy carrier, followed by petroleum products. Electricity dominates energy use in manufacturing, the household sector and service industries, while petroleum products account for a large proportion of energy use in sectors that make heavy use of transportation and machinery. District heating account for only a small share of energy use, but this has been increasing in recent years. Consumption of district heating has risen slightly in recent years. These energy carriers have been replacing fossil fuels and petroleum products for heating and in industrial processes.
The energy intensity of the Norwegian economy has declined by 45 per cent since 1990. This indicates a decoupling of economic growth and energy use.
Per capita energy use has also declined in Norway during this period and was about 10 per cent lower in 2023 than in 1990.
Features of the Norwegian energy system
Renewable energy sources account for 98 per cent of Norwegian electricity production and the power sector has very low emissions compared to most other countries. In a normal year renewable electricity generation exceeds gross domestic consumption.
At the end of 2023, the installed capacity of the Norwegian power supply system was 40 077 MW with an estimated annual production of 157.8 TWh in a normal year.
Over the past few years, Norway has been developing more renewable power production capacity than it has done for over 25 years due to increased profitability for more renewable technologies. Wind power currently accounts for only a relatively modest share of production capacity, but between 2016 and 2022 the installed capacity increased from about 874 MW to about 5,073 MW. At the end of 2023, estimated annual wind power production corresponded to almost 17 TWh in a normal year. In recent years, the installed capacity of solar power has increased sharply, and in 2023 the installed capacity was doubled from about 300 MW to about 600 MW by the end of the year.
Hydropower accounts for approximately 88 per cent of Norwegian power supply, and the resource base for production depends on the precipitation levels between years. Norway has half of Europe’s reservoir storage capacity, and more than 75 per cent of Norwegian production capacity is flexible. Production can be rapidly increased and decreased and serves as an important provider of flexibility in the power system. This is a distinctive feature of the Norwegian power system.
The Norwegian power system is closely integrated with the other Nordic systems, both in physical terms and through market integration. In turn, the Nordic market is integrated with the rest of Europe through cross-border interconnectors with the Netherlands, Germany, the Baltic states and Poland.
In 2023, district heating deliveries totalled 7.9 TWh, about five times as much as in 2000. This is equivalent to about one sixth of the total energy consumption in households per year in Norway.
District heating can be produced using many different types of fuel. In 2023, almost 42 per cent of district heating was produced from waste and about 38 per cent from bioenergy. The use of petroleum products has declined since 2018. Mineral oil accounts for only 1 per cent of district heating production.
Bioenergy is an important energy source for heat production in Norway. Annual consumption of bioenergy in Norway rose from 10 TWh in 1990 to about 17.5 TWh in 2010. Since then, the consumption has varied and was about 20 TWh in 2023. Fuelwood consumption in households accounts for a large proportion of biofuel consumption and totalled more than 6 TWh in 2023. The second largest user is the manufacturing sector, where chippings and other wood waste are used as fuel in production processes.
The Norwegian government has an ambition to award areas that has potential for 30 GW of offshore wind capacity by 2040. In 2020, the first areas on the Norwegian continental shelf were opened for offshore renewable energy production. In 2023, Sørlige Nordsjø II was announced as the first project area, and, following a successful auction, was awarded in April 2024.
The Hywind Tampen wind farm is the world’s largest floating offshore wind farm, which supplies 88 MW of power to the Snorre and Gullfaks petroleum fields. In 2022, the Hywind Tampen was set in operation.
Petroleum
Petroleum activities have given substantial impetus to Norway’s economic growth and has helped finance the Norwegian welfare system. According to the Norwegian Offshore Directorates latest resource account, about half of the estimated recoverable resources on the Norwegian shelf have been produced and sold so far.
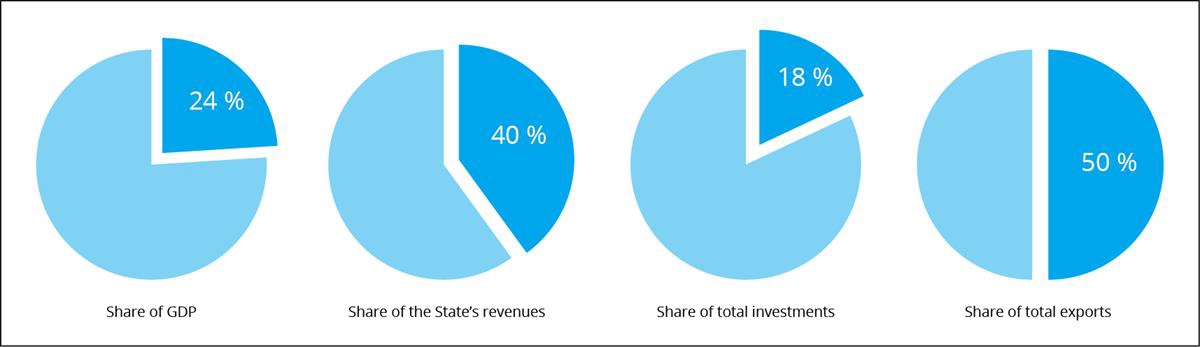
According to data for 2023 published by Statistics Norway in November 2024, greenhouse gas emissions from petroleum activities amounted to 11.6 million tonnes of CO2 equivalents in 2023. These emissions account for about a quarter of the total Norwegian greenhouse gas emissions. Emissions have increased by 40.1 per cent since 1990. Emissions peaked in 2015 and have declined since, mainly due to increased use of renewable power from shore on petroleum installations.
Figur 2.4 Macroeconomic indicators for the petroleum sector in 2023
The service and supply industry is not included.
Source: National Accounts, the National Budget 2025
Since production started, oil and gas have been produced from a total of 123 fields8 on the Norwegian shelf. At the end of 2023, 92 fields were in production: 67 in the North Sea, 23 in the Norwegian Sea and two in the Barents Sea.
In 2023, Norwegian petroleum production accumulated to 233.2 million Sm³ o.e., which is about the same level as production in 2022. By comparison, total production in the record year of 2004 was 264.2 million Sm3 o.e. Total production is expected to reach a peak in 2025, and then decrease over time.
Oil production in 2023 was higher than in 2022. The main reason is startup of production from new fields. Gas sales totalled 116 billion Sm³ (40 MJ) in 2023, a decrease from the production in 2022. The reason for the reduction is mainly extended maintenance activities on the onshore facilities. In 2023, natural gas accounted for 50 per cent of the total production measured in oil equivalents.
Like oil, gas is one of Norway’s most important export commodities. Domestic consumption of gas is low, and nearly all the gas produced is exported. An extensive network of subsea pipelines links Norway’s offshore gas fields and onshore terminals directly to recipient countries in Europe. In addition, liquefied natural gas (LNG) is shipped out from the Snøhvit field off Hammerfest on LNG carriers.
About 46 per cent of Norway’s estimated gas resources have been produced and sold so far. Gas production is expected to remain at a high level for the next years.
Norway is the largest producer and only net-exporter of oil and gas in Europe. In 2023, Norway exported about 116 billion Sm3 gas. In large parts of Europe, gas is an important source of energy for heating, industrial use and for electricity generation in gas-fired power plants. Norwegian gas now covers nearly 30 per cent of the EU’s and the UK’s combined gas consumption and provides an important contribution to energy security in Europe. The total length of the Norwegian gas pipeline network is about 8,800 kilometres. Most Norwegian gas sold in the European market is delivered to Germany, the UK, Belgium and France. In the short and medium term, Norwegian natural gas may support the phasing-out of coal in the European power sector, and may be an important co-player with renewables in the efforts to reduce emissions. Gas can be stored and serve as a flexible energy source for heat and electricity production, balancing supply and demand.
Transport
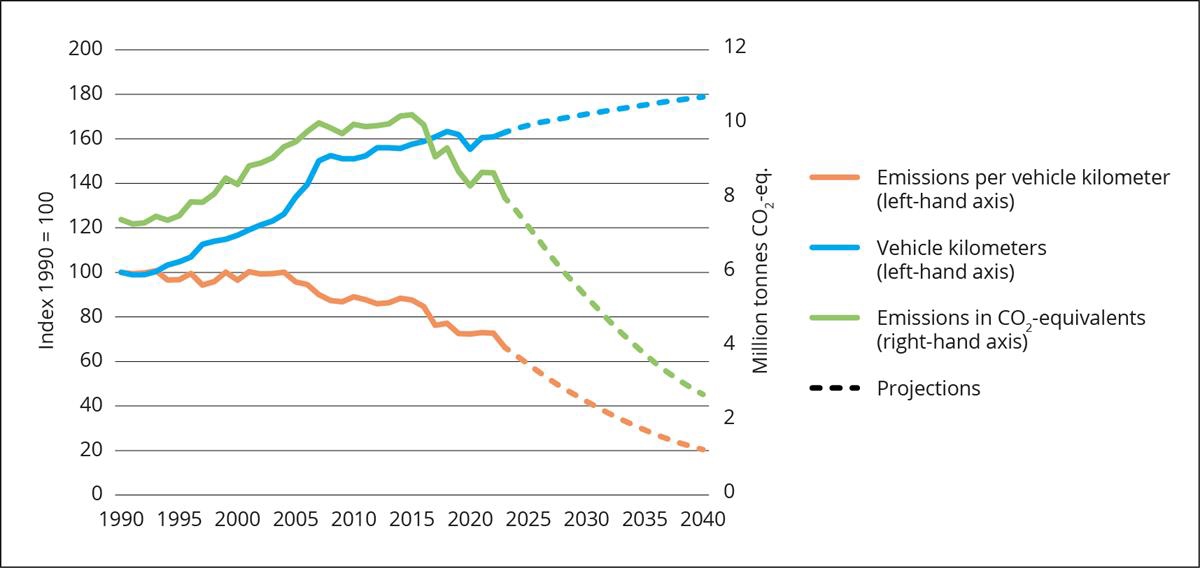
Norway’s decentralised settlement gives rise to a relatively high demand for transport. In addition, the Norwegian economy is largely based on the extraction of raw materials and exports of goods, which means that there is a large volume of goods transport. About one third of the total Norwegian greenhouse gas emissions originated from transport in 2023.
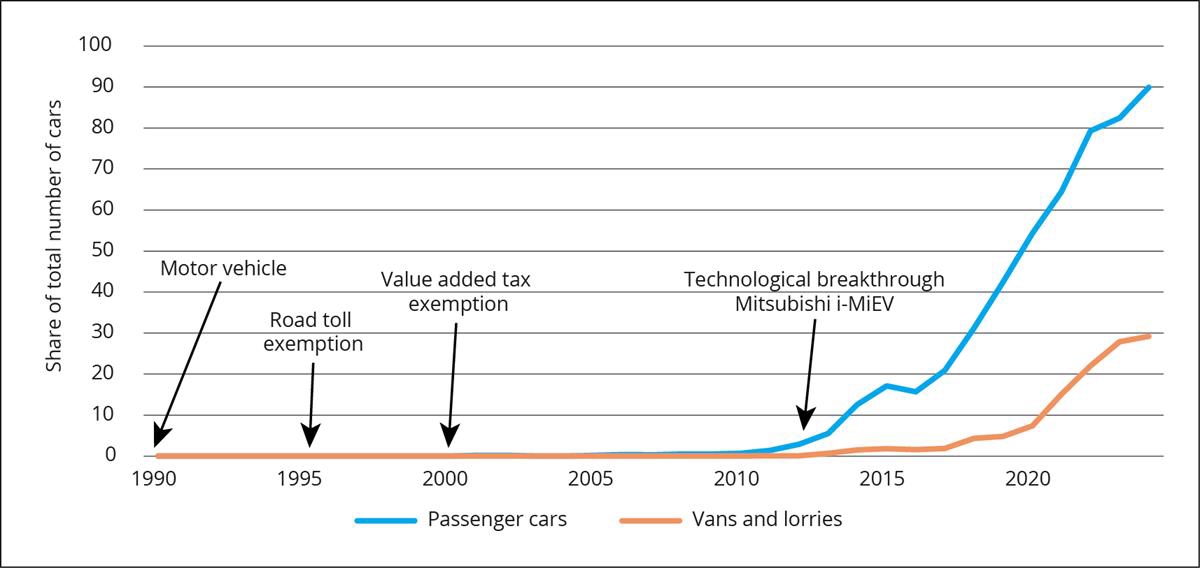
According to data for 2023 published by Statistics Norway in November 2024, the emissions from road transport were approximately 8 per cent above 1990-levels in 2023. Road transport emissions have decreased since 2015, partly due to biofuels replacing fossil fuels. The rise in zero-emission vehicle usage is another factor contributing to the reduction in road transport emissions. The market share for electric vehicles has increased steadily in recent years. So far in 2024, electric vehicles has had a market share close to 90 per cent for new passenger cars, while in 2020 the share was 53 per cent. For light-duty vehicles, the market share for new electric vehicles has risen from 9 per cent in 2020 to almost 30 per cent so far in 2024. Also, for heavy duty vehicles there has been an increase in the market share of electric vehicles in the recent years. Electric city buses had a market share of almost 70 per cent so far in 2024. For long distance buses and trucks, the development has been somewhat slower. So far in 2024, electric long-distance buses and trucks held market shares of 24 per cent and 12 per cent, respectively. These shares are expected to increase in the coming years, driven by technological improvements and climate policies.
Since more than 80 per cent of railway traffic in Norway is electric, railway transport only account for a small share of the total emissions. Direct emissions from the railway sector mainly comes from transport on the diesel driven tracks, and from construction, operations and maintenance of the railway infrastructure. Emissions from railways (including passenger and freight transport) has remained more or less constant at 50,000 tonnes CO2-equivalents in the last few years, accounting for about 0.1–0.3 per cent of the total emissions from the transport sector.
In 2023 there were 78.2 million railway passengers. Passenger traffic by railways was strongly affected by the pandemic. Even though there has been growth in recent years, there are still 2 million fewer passengers than in the peak year of 2019.
For domestic goods transport, there was an increase in tonne-kilometres from 2019 to 2023. For goods transport excluding cabotage, the increase was 11.1 per cent, while for goods transport including cabotage, the increase was 9.3 per cent. Transportation of goods by railways witnessed an increase during the pandemic but has decreased since 2021. In 2023 freight transport decreased with 7.5 per cent. The extreme weather event «Hans» and other weather events have led to increased and prolonged downtime on the railway network. In August 2023, the Randklev bridge collapsed due to flooding, preventing freight transport on the Dovrebanen. The bridge was reopened in May 2024.
Domestic civil aviation was greatly affected by the travel restrictions enforced due to COVID-19. These were partly still in place in beginning of 2022. The subsequent increase in price levels and cost of living, higher interest rates and geopolitical unrest have resulted in people travelling less by plane compared to 2019. The overall number of passengers was down 10 per cent in 2023 compared to pre-Covid levels. The travel pattern has also changed. There are fewer business travellers than before, and domestic travel activity has flattened. There is however an increasing trend in international air passengers (mainly from increased tourism) in the domestic market. As a result of this greenhouse gas emissions from domestic civil aviation (including helicopters) are still slightly below 2019 levels.
Industrial processes and product use (IPPU)
A considerable part of Norwegian manufacturing industries is based on natural resources. The historic availability of low-cost hydro power created a basis for the establishment of metal and fertilizer production. Some chemical production is based on the petroleum resources. Production of pulp and paper derived from the forest resources has also been considerable, and the fisheries have also given a base for industry. Norwegian industry therefore has a high share of production of raw materials and semi-manufactured goods including iron and steel, non-ferrous metals, chemicals, fertilisers, pulp and paper, mineral industries, food processing industries, building and construction industry.
The emissions from the IPPU sector were at about 19 per cent of the national totals in 2022. The emissions have decreased by 37 per cent from 1990.
Waste
The waste sector, with emissions of 1.4 million tonnes of CO2 equivalents in 2022, accounted for 2.9 per cent of the national GHG emissions. Most of the emissions from the waste sector originate from solid waste disposal on land (61 per cent).
Economic growth, or growth in production and consumption, is the key driver behind the growing waste volume. Even though the total amount of waste generated has increased, GHG emissions from the waste sector have generally decreased since 1990. This is due to the increase in material recycling and the ban issued in 2009 on disposing biodegradable waste to landfill. The central government authorities set the general framework, while municipalities and industry are responsible for waste collection and treatment.
In general, targets set in EU waste directives, such as EU targets for preparing for reuse and recycling of municipal waste, also apply for Norway owing to the EEA agreement.
Agriculture
Stretched along the western side of the Scandinavian Peninsula, approximately one fourth of the surface area of Norway lies north of the Arctic Circle. The long coastline has an Atlantic, humid climate, while the inland climate is continental. Approximately 3 per cent of Norway’s land area is cultivated soil. The most suitable lands, approximately 1 per cent, is mostly allocated to arable crops, while grassland and ruminant livestock are allocated to regions less suitable for arable crops. While cultivated soil is a scarce resource in Norway, in addition we have extensive pastureland that is used extensively by reindeer husbandry and summer pasture for other ruminant livestock.
Agriculture is estimated to account for about 9.5 per cent of Norway’s emissions of greenhouse gases in 2022. This particularly includes methane and nitrous oxide from animal husbandry and fertilisation. In addition, nitrous oxide emissions from cultivation of peatland are allocated to agriculture, while CO2 emissions from the same source are allocated to LULUCF. Use of fossil fuels for agricultural activities are allocated to other sectors, e.g. transport. The agricultural emissions have been reduced by approximately 6.8 per cent since 1990.
2.1.2.1 Land use, land-use change and forestry (LULUCF)
Forest and wooded land cover about 12 million hectares and constitute approximately 38 per cent of the land area in Norway. Approximately 88 per cent – that is 120,000 properties – of the forest area is privately owned. The majority of the forest holdings are farm and family forests. Grassland has the second largest area covering as much as 35 per cent of the mainland, with the vast majority categorized as extensive grasslands.
Net land-use changes in Norway from 1990 to 2022 are small compared to the total area. Overall, the area of settlements has increased from 1.8 per cent of the total area in 1990 to 2.2 per cent in 2022. Forest land, grasslands, and wetlands have shown a slight decline in area, while cropland and other land have remained more or less constant.
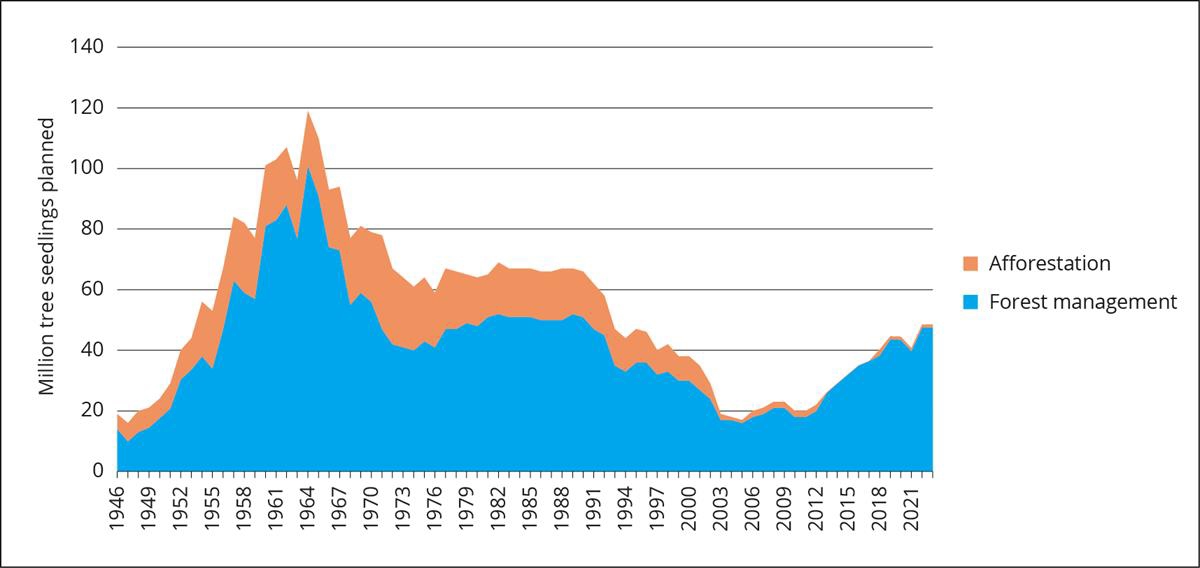
The most widespread species are Norway spruce (47 per cent), Scots pine (33 per cent) and birch (18 per cent). The historical levels of tree planting in the Norwegian forestry are shown in Figure 2.5. Norway spruce (picea abies) and Scots pine account for more than 95 per cent of the seedlings. Broadleaves and foreign tree species are only planted to a small extent.
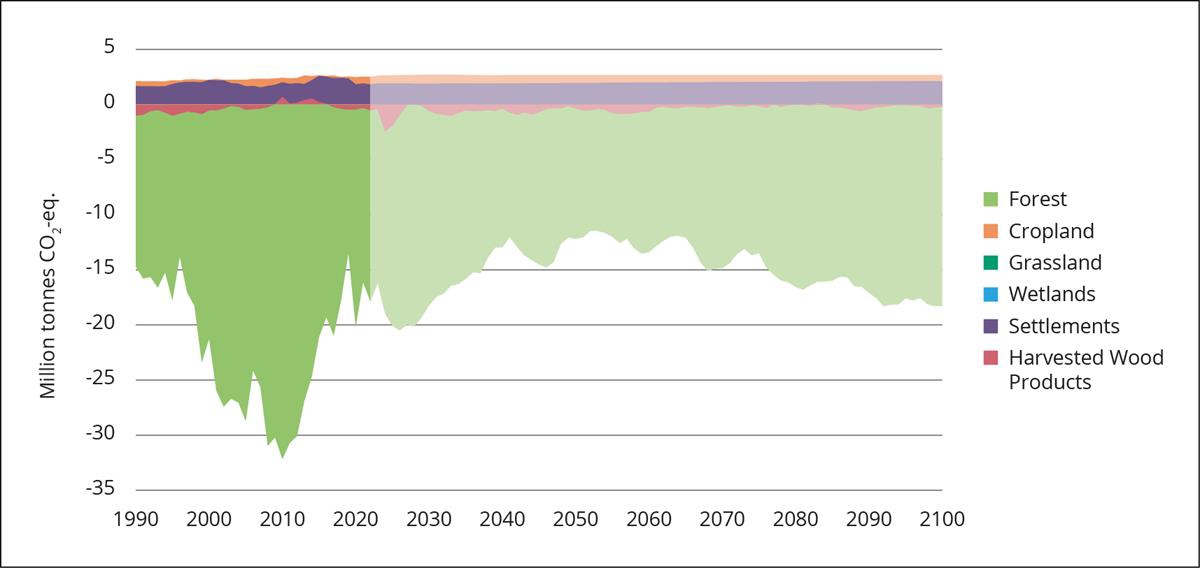
From 1990 to 2010, both carbon sequestration and emissions in the LULUCF sector increased, while the net carbon sequestration declined from 2011 to 2022. In 2022, net sequestration in the sector was estimated at 13.8 million tonnes of CO2 equivalents, equivalent to 28 per cent of Norway’s total greenhouse gas emissions. Forests are the primary source of carbon sequestration, accounting for 17.9 million tonnes of CO2 equivalents in 2022, compared to 14.7 million tonnes in 1990. Due to methodological changes after UN revisions, the LULUCF removals are significantly lower (approximately 6.5 million tonnes ) than in Norway`s 8th National Communication. Post-war forest planting has played an important role in this sequestration. However, the decline in sequestration since 2010 has been driven by drought in 2018 with delayed recovery, increased logging, a rise in the proportion of mature forests with slower growth rates, and reduced forest planting and silvicultural activities in recent decades.
Emissions from deforestation, associated with land-use change from forest to other land categories (e.g., agriculture and urban development), increased from 2.1 million tonnes in 1990 to 2.5 million tonnes of CO2 equivalents in 2022. Emissions from settlements contribute to yearly emissions of about 1.9 million tonnes, and these emissions are projected to remain stable towards 2050.
Figur 2.5 Historical levels of tree planting in the Norwegian forestry
Source: Ministry of Agriculture and Food
2.1.3 Institutional arrangements
The overall national climate policy is decided by the Storting (Norwegian Parliament), and the government implements and administers the most important policies and measures, such as economic instruments and direct regulations. Most policies and measures in the area of climate policy are developed through interministerial processes before the political proposals are tabled. The Ministry of Climate and Environment has the overarching responsibility for coordinating climate efforts and reporting on the overall achievement of climate goals. The Ministry of Finance is responsible for the tax schemes. The other ministries are responsible for policies in their respective sectors. The Ministry of Climate and Environment organizes the work of developing and further refining the decision-making basis through a climate governance system.
Norway has several legislative arrangements in place in order to help reduce emissions of greenhouse gases, such as the Pollution Control Act, the Greenhouse Gas Emissions Trading Act, the CO2 Tax Act, and the Petroleum Act, as well as requirements under the Planning and Building Act. The relevant arrangements will be discussed in more detail in chapter 2.5.
The Climate Change Act
In June 2017, the Norwegian Parliament adopted the Climate Change Act, which establishes by law Norway’s emission reduction targets for 2030 and 2050. The purpose of the act is to promote the long-term transformation of Norway in a climate-friendly direction. See further description of Norway’s climate targets in 2.2.
The act has an overarching function in addition to existing environmental legislation. The Climate Change Act introduces a system of five year reviews of Norway’s climate targets, on the same principle as the Paris Agreement. In addition, the act introduces an annual reporting mechanism. The Government shall each year submit to the Parliament updated information on status and progress in achieving the climate targets under the law, and how Norway prepares for and adapts to climate change. Information on the expected effects of the proposed budget on greenhouse gas emissions and projections of emissions and removals are also compulsory elements of the annual reporting mechanism. Since 2018, the Government has annually reported information as required by the Climate Change Act as part of the state budget process in October each year. Since 2022, the reporting has been submitted to the Storting as sperate annex to the state budget named Climate Status and Plan, which is further explained in Box 2.1 in chapter 2.3.
On 1 October the Government issued on a public consultation a proposal for a new climate target for 2035 to be included in the Norwegian Climate Change Act9. The consultation ends 1 January 2025. After the consultation the Government will send a concrete proposal to the Parliament for approval and adoption.
Climate Governance System
In addition to complying with the reporting mechanism of the Climate Change Act, the Government’s Climate Status and Plan presented a Climate Governance System in 2022. The purpose of the climate governance system is to facilitate the achievement of Norway’s climate goals. The system aims to provide processes for improved coordination for informed decisions, implementation, and reporting. It establishes annual routines and milestones for the design, follow-up, and reporting, as well as milestones for further development of climate policies. Some decision-making milestones are coordinated with the Government’s internal budgetary processes, enabling budgetary decisions as well as decisions on other climate policies to be informed by their estimated effect on emissions and the achievement of climate targets. The government’s annual Climate Status and Plan and regular white papers to the Storting present updates on climate policy developments and plans as well as progress towards meeting climate goals. Policies developed for purposes other than climate mitigation but still affecting greenhouse emissions are developed across sectors and presented in different white papers, action plans, and strategies. The system is being developed further.
Institutional arrangements related to cooperation with the EU
Norway intends to fulfil its climate target (Nationally Determined Contribution) for 2030 under the Paris Agreement in cooperation with the EU. The Emissions Trading System is a part of the EEA agreement. This cooperation will be reflected through transfers and acquisitions of ITMOs pursuant to Article 6 of the Paris Agreement. Details of the cooperation including the institutional arrangements for Article 6 will be reported in a forthcoming Initial Report pursuant to Decisions 2/CMA. 3 and 6/CMA. 4. The Ministry for Climate and Environment has however established arrangements for acquisition of units under the pillars ESR and LULUCF in the cooperation with EU, as well as a program for acquisition of ITMOs, both pursuant to allotments in the state budget.10 These programs are expected to acquire ITMOs and can be drawn upon in case domestic measures and cooperation with the EU does not lead to a full realisation of emission/removal budgets under the cooperation with EU and/or the cooperation does not fully realize Norway’s climate target in the NDC for 2030.
Local governments
Local governments are responsible for implementing policies and measures at the local level, for example through waste management, spatial and societal planning and some transport measures. In 2009, central government planning guidelines (Nw. statlige planretningslinjer) for climate and energy planning were introduced in municipalities. Since 2018, these guidelines also include a description of how municipalities and counties can incorporate climate adaptation work into their planning activities. The government is in the process of revising the guidelines, with the goal of clarifying expectations for municipalities’ ambitions and results in energy and climate work. The work is now in its final phase, and the new guideline is expected to be finished in the beginning of 2025.
Public participation
The Environmental Information Act, implementing the Aarhus Convention, establishes public participation in decision making processes relevant for the environment. For example, the Climate Change Act was on a public hearing including all stakeholders. All plans made in accordance with the Planning and Building Act must also be subject to public participation.
The Norwegian Environment Agency
The Norwegian Environment Agency is a government agency under the Ministry of Climate and Environment. The Environment Agency implements government pollution and nature management policy. Important fields of work in relation to pollution control include climate, hazardous substances, water and the marine environment, waste management, air quality and noise. The Environment Agency manages and enforces the Pollution Control Act, the Product Control Act and the Greenhouse Gas Emission Trading Act, and the Nature Diversity Act, among others. The Environment Agency grants pollution permits, establishes requirements and sets emission limits, and carries out inspections to ensure compliance.
The Norwegian Environment Agency provides analyses and impact assessments related to environmental policies and measures. One example is an annual mitigation analysis on climate, which informs the government and the public on possible mitigation actions to reduce Norwegian greenhouse gas emissions.11
The Environment Agency monitors the state of the environment. The Agency provide environmental information to the public through their home page.12 The Agency also informs about Norway’s climate and environmental goals.13
The Environment Agency supervises and monitors the County Governors’ work on pollution, coordinates the County Governors’ inspection work and organises joint inspections. The Environment Agency provides guidelines for the County Governors and also deals with appeals against decisions made by the County Governors.
The Environment Agency participates in a series of international processes, to promote regional and global agreements that reduce serious environmental problems. Moreover, the Environment Agency also cooperates with the environmental authorities in other countries, sharing competence and furthering environmental improvements.
The Norwegian Environment Agency is appointed as a national entity with overall responsibility for the GHG inventory and the reporting of the inventory. The GHG inventory is produced and reported in collaboration with Statistics Norway and the Norwegian Institute of Bioeconomy Research. The three institutions are responsible for archiving necessary documentation.
There have not been any significant changes to the institutional arrangements since Norway reported its 8th National Communication in 2022.
2.2 Norway’s climate policy and targets
Norway’s climate policy is based on the objective of the United Nations Framework Convention on Climate Change and the Paris Agreement. The scientific understanding of the greenhouse effect set out in the reports from IPCC is an important factor in developing climate policy. Thus, the policies and measures reported are seen as modifying long-term trends in anthropogenic greenhouse gas emissions and removals.
Climate change and emissions of greenhouse gases have featured on the policy agenda in Norway since the late 1980s. Today, Norway has a comprehensive set of measures covering almost all emissions of greenhouse gases as well as removals.
Norway has ambitious climate targets, both under the Paris Agreement and within a domestic context, forming a basis for the policies and measures:
Paris Agreement NDC
The nationally determined contribution (NDC) is to reduce emissions by at least 55 per cent by 2030 compared to 1990. The NDC target is included in the Norwegian Climate Change Act.
On 1st October 2024 the Government issued a proposal for a new climate target for 2035 to be included in the Norwegian Climate Change Act for public consultation until 1st January 2025. After the consultation the Government will send a concrete proposal to the Parliament for approval and adoption. After the Parliamentary approval Norway will submit its target as its new NDC under the Paris Agreement.
Targets in a domestic context
Become a low-emission society by 2050 and reduce emissions by 90–95 per cent compared to 1990. The effect of Norway’s participation in the EU Emissions Trading System is to be taken into account in assessing progress towards this target. The target is included in the Norwegian Climate Change Act.
As an interim goal on the road to net zero emissions and the low-emission society, the government has set a transition target for the entire economy in 2030. This is formulated in the government platform as a target to cut Norwegian emissions by 55 per cent compared to 1990.
Be climate neutral from 2030.
2.3 Description of Norway’s NDC for 2030
This chapter of the BTR describes Norway’s NDC under Article 4 of the Paris Agreement against which progress will be tracked. Following the decision 1/CMA.3 Glasgow Climate Pact paragraph 29, Norway revisited the 2030 target in its Nationally Determined Contribution (NDC). In November 2022, Norway communicated its updated NDC to reduce emissions by at least 55 per cent by 2030, compared to 1990 levels.14
Details of Norway’s NDC are shown in Table 2.2. The NDC is economy wide and is a single-year target in 2030. It covers the gases carbon dioxide (CO2), methane (CH4), nitrous oxide (N2O), perfluorocarbons (PFCs), hydrofluorocarbons (HFCs), sulphur hexafluoride (SF6) and nitrogen trifluoride (NF3)15. The NDC covers all the sectors in the GHG inventory. Emissions and removals from the LULUCF sector that are additional will be accounted for when assessing achievement of the target.
Norway’s intention is to fulfil this target in cooperation with the EU. This will be done within the framework set up by Article 6 of the Paris Agreement. In the event that the cooperation with the EU does not lead to a full realization of the target, Norway intends to use ITMOs acquired from countries outside the EEA.
Tabell 2.2 Description of a Party’s nationally determined contribution under Article 4 of the Paris Agreement, including updates
Description
Target(s) and description, including target type(s), as applicable
Economy-wide, emission reductions by at least 55 per cent in 2030 compared to base year (1990) emissions.
Target year(s) or period(s), and whether they are single-year or multi-year target(s), as applicable
Single-year target in 2030.
Reference point(s), level(s), baseline(s), base year(s) or starting point(s), and their respective value(s), as applicable
Base year: 1990. Base year value: 51 263.14 kt tonnes CO2 equivalents
Time frame(s) and/or periods for implementation, as applicable
From 1st January 2021- 31st December 2030.
Scope and coverage, including, as relevant, sectors, categories, activities, sources and sinks, pools and gases, as applicable
Sectors: Energy, industrial processes and product use, agriculture, land-use, land-use change and forestry, and waste.
For the land-use, land-use change and forestry sector, emissions and removals the following reporting categories are included: forest land, cropland, grassland, and wetland (wetland remaining wetland only from 2026), including land use changes between the categories, and between these categories and settlements and other land. The five carbon pools above-ground biomass, below-ground biomass, litter, dead wood and soil organic matters are included. In addition, the carbon pool harvested wood products is included.
Emissions and removals from the LULUCF sector that are additional will be accounted for when assessing achievement of the target, see chapter 2.3 for further details.
Intention to use cooperative approaches that involve the use of ITMOs under Article 6 towards NDCs under Article 4 of the Paris Agreement, as applicable
Yes. Norway pursues cooperation with the EU on implementing the respective NDCs to be reflected in accordance with rules under Article 6 of the Paris Agreement. If the cooperation with the European union does not fully realize the NDC target, Norway will use voluntary cooperaton cooperation with countries outside the European Economic Area to fulfil the part of the NDC that goes beyond what is achieved with the European Union. See chapter 2.3 of this BTR for details .
Any updates or clarifications of previously reported information, as applicable
Norway will report on its choice of accounting method for cooperative approaches in its forthcoming Initial Report pursuant to the rules under Article 6 in Decision 2/CMA.3.
EU and Norway need to agree on how to account for the reductions achieved in the common Emissions Trading System (such an agreement was made pursuant to the unit flow under the Kyoto Protocol) and rules pertaining to any flows of ITMOs reflecting flows of units under other pillars of the cooperation.
Iceland and Norway entered into an agreement with the EU in October 2019 to cooperate to fulfil their respective climate targets for 2030. Under the agreement, Norway will take part in EU climate legislation from 2021 to 2030. Final accounting towards the target pursuant to the guidance under Article 6.2 may depend on any further arrangements in Norway’s cooperation with the EU and Iceland, in particular resulting from participation in the European Emissions Trading System. Norwegian entities have undertaken and is expected to further undertake a net purchase of allowances in the ETS in the current NDC period. This net purchase will be reflected in a net acquisition of ITMOs to be accounted towards the NDC. Further specification of accounting method is to be developed by Norway and EU in accordance with rules set up by the CMA in Glasgow in 2021 so as to avoid double counting. If necessary, Norway will use voluntary cooperation with countries outside the EEA under Article 6 of the Paris Agreement to fulfil any part that goes beyond what is achieved through the climate cooperation with the European Union. Norway has established a purchase program for ITMOs from developing countries that could be used in such an event.16 The program is allotted NOK 8.2 billion through the state budget. An agreement is signed with Uzbekistan through the World Bank program Transitional Carbon Asset Facility (TCAF), and initial MoUs or agreements are developed with Benin, Indonesia, Jordan, Morocco, Senegal and Zambia for cooperation facilitated by the Global Green Growth Institute.
The EU’s climate policy has three main pillars. The first pillar of EU climate policy deals with ETS emissions. The EU Emissions Trading System applies to the largest emission sources within Norwegian manufacturing industries and the petroleum industry through the European Economic Area (EEA). The cap, or number of emission allowances in the system, is being gradually reduced to achieve a reduction of 62 per cent in emissions in 2030 compared with 2005. This is an overall reduction for all installations covered by the EU ETS. Emissions from European aviation have been included in the EU ETS since 2012, while emissions from maritime transport are gradually included from 2024.
The second pillar of EU climate policy deals with emissions not covered by the EU ETS, but by the effort sharing regulation (ESR) mainly covering emissions from transport, agriculture, buildings and waste. Norway’s current target for the ESR emissions under its agreement with the EU is a 40 per cent reduction by 2030 compared with the 2005 level. This has been translated into a binding emission budget with emission ceilings for each year in the period 2021–2030. The legislation allows for each country’s emission budget to be met through a combination of emission reductions within the country and transfers of emission units from other EU countries.
The third pillar of EU climate policy deals with the Land Use, Land Use Change and Forestry (LULUCF) sector. This includes anthropogenic emissions and removals of greenhouse gases from land use, land use change and forestry. The factors that particularly influence emissions and removals are growth, mortality and the level of harvesting (relative to harvest level modelled in the forest reference level FRL (2021–2025, or reference period (2026–2030)), land-use change such as deforestation and afforestation, and the natural spread of forest and scrub. The EU’s climate legislation includes accounting rules for emissions and removals in the LULUCF sector. However, neither Norway nor EU are applying these rules for accounting contributions from LULUCF towards the NDC. Under the EU legislation, Norway currently has an obligation to ensure that overall greenhouse gas emissions from the LULUCF sector do not exceed removals (this is known as the ‘no debit’ rule). According to the regulation, the obligation can be fulfilled by implementing measures in the national LULUCF sector, and/or through extra national reductions in non-ETS emissions, for example in the transport and agriculture sectors, and/or through purchasing units from EU countries or Iceland.
When Norway and the EU concluded their agreement on implementing the EU legislation on ESR and LULUCF, the targets each of these parties had communicated to the UN was a 40 per cent reduction in emissions by 2030 compared with the 1990 level. Both the EU and Norway have communicated more ambitious targets to the UN after the conclusion of the agreement, and the EU has adopted amendments to its legislation in order to ensure that the more ambitious target is achieved. Norway is considering whether the updated EU legislation on ESR and LULUCF should also be made applicable in Norway, and if so on what conditions. The updated legislation will not apply to Norway until the Storting has given its consent.
Norway is not mentioned in the referenced updated EU legislation. Based on the targets for ESR emissions that apply for comparable countries, it is likely that Norway can get a reduction target of 50 per cent reduction compared to 2005 should the climate agreement with the EU be updated. Such a target will be translated into a binding emission budget with emission ceilings for each year in the period 2021–2030. For information on the climate status and plan for the 2030 climate target where assumed targets are pursued, see Box 2.1.
Boks 2.1 Annual Climate Status and Plan
The Climate Status and Plan summarises the government’s climate policy, and it is the government’s annual report on the information required by the Climate Change Act. The Støre Government presented an updated Climate Status and Plan in a separate attachment to Prop. 1 S (2024–2025) in October 2024.
Since Norway and the EU both have individual NDCs/targets under the Paris Agreement, the cooperation is envisaged to include transfers and acquisitions of ITMOs and follow the guidance under Article 6 of the Paris Agreement. See Box 2.2 for further information.
ESR emissions
Chapter 2.7 of this BTR presents updated projections of GHG emissions. Table 2.8 shows that the projections for the ESR emissions are estimated to decrease from 25.2 million tonnes CO2 eq. in 2022 to 19.8 million tonnes CO2 eq. in 2030. The projections for the period 2021–2030 are about 13 million tonnes CO2 eq. higher than the given emission budget under the current EU legislation for the ESR sector (40 per cent reduction in 2030 compared to 2005).
Correspondingly, the emissions are about 22 million tonnes CO2 eq. higher than the estimated emission budget Norway may get, should the climate agreement with the EU be updated and Norway gets a reduction target of 50 per cent compared to 2005, based on the proposal from the EU Commission. The Støre-government is therefore making provisions for, and is planning to, reduce the ESR emissions by 50 per cent by 2030.
In the budget proposal for 2025 and the attached Climate Status and Plan, the Støre-government proposes climate measures that can reduce the GHG emissions. It is estimated that measures proposed in the Climate Status and Plan can reduce the non-ETS emissions by 16.5 million tonnes of CO2 eq. in the period 2021–2030. The planned measures are reported as projections with additional measures (WAM), see chapter 2.5.11 and chapter 2.7.6 for further information.
With these measures the total estimated ESR emissions for the period 2021–2030 would be about 2.8 million less than the emission budget under the current EU legislation for the ESR sector (40 per cent reduction in 2030 compared to 2005). Estimated emissions including planned measures for the period 2021–2030 would be 5.4 million higher than the estimated emission budget Norway may get should the climate agreement with the EU be updated and Norway gets a reduction target of 50 per cent compared to 2005. For the year of 2030, estimated emission reductions including planned measures are about 46 per cent compared to 2005-levels.
Box 2.1 continued
Based on these projections, Norway is expecting to have to use flexible mechanisms in addition to national measures to meet the commitment over the period 2021–2030. Norway has access to approximately 5.8 million converted allowances from the EU ETS, which can be used under ERS and land-use regulations. The government has set aside funds for utilisation of further flexibility if needed through acquisition of units from other counties. However, the availability of units under both the ESR and the LULUCF from EU countries is unknown, as well as the price.
Boks 2.2 Pursuing cooperation with the EU on implementing the respective NDCs
Norway pursues cooperation with the EU on implementing their respective NDCs. Norway, Iceland and Liechtenstein have been participating in the EU ETS since 2008. For the period from 1st January 2021 to 31st December 2030, Norway is pursuing its cooperation with the EU on implementing their respective NDCs and have together with Iceland agreed to implement the EU Effort Sharing Regulation (ESR) and LULUCF Regulation in accordance with the EEA Agreement Protocol 31.
Cooperation on implementation of the NDC enables Norway to have a higher level of ambition and thus gives a benefit to the atmosphere. In 2019, the EU, Iceland and Norway agreed on cooperation to fulfil our respective prevailing NDCs. Since then, the EU, Iceland and Norway have updated their respective NDCs and strengthened the targets substantially. The conditions for Norwegian participation in the updated European legislation (Effort Sharing Regulation and LULUCF Regulation) will need to be agreed between EU and Norway before arrangements related to cooperative approaches pursuant to Article 6 of the Paris Agreement on implementation of the updated NDCs can be finalised.
Details concerning the possible flow of internationally transferred mitigation outcomes (ITMOs), accounting approaches, national arrangements, registries, other reporting requirements including related to adaptation finance and overall mitigation of global emissions, will be addressed in future reporting under the Paris Agreement, in particular the Initial Report pursuant to the Article 6 guidance.
2.4 Information necessary to track progress made in implementing and achieving Norway’s NDC
Norway’s point of departure for accounting and showing progress towards the NDC target is the inventory figures. Voluntary cooperation with other countries, and subsequent accounting for ITMOs received, is a central element in the implementation of the NDC. There will be several years’ delay in the transfer of ITMOs reflecting the underlying cooperative approaches with EU and potentially other countries outside of the European Economic Area.
Norway expects that the net flow of allowances between EU and Norway in the European ETS will be the basis for transfer of ITMOs also under the Paris Agreement, as was the case under the Kyoto Protocol. Further details defining such net flow is to be agreed between the parties. However, Norwegian companies have acquired and used significantly more allowances in the ETS than we expect that Norway will be held responsible for under this cooperative approach, which will then lead to a significant transfer of ITMOs from EU to Norway. Under the Kyoto Protocol such transfers closed most of the gap between the actual Norwegian emissions and the commitments in both periods; see the final compilation and accounting reports17. The remaining gap was closed using units from the Clean Development Mechanism and also some from Joint Implementation.
Norway, as well as the EU and other cooperating partner countries, will have to submit our respective Initial Reports pursuant to Decision 2/CMA. 3 (and 6/CMA.4 and X/CMA.6) to spell out further details around the accounting.
2.4.1 Indicator, methodologies and structured summary
This section of the BTR contains information in accordance with paragraphs 65–77 and 79 of the MPGs. The information is also reported in CTF tables 1 to 4.
2.4.1.1 Indicator for tracking progress
Norway has selected the indicator «emissions without LULUCF» as the indicator representing the point of departure in tracking progress towards the implementation and achievement of Norway’s NDC. The unit and metric are the same as the NDC’s base year value and target value. Tables 2.3 and 2.4 provide more information on this indicator. Additional emissions and removals from the LULUCF sector and ITMOs acquired under Article 6 of the Paris agreement will add clarity on the progress towards the 2030 target and will be reported in future BTRs.
Total CO2 equivalent emissions, including indirect CO2, without LULUCF.
Information for the reference point(s), level(s), baseline(s), base year(s) or starting point(s), as appropriate
The reference level is the total CO2 equivalent emissions, including indirect CO2, without LULUCF reported for the base year 1990. The reference level for Norway is 51 263.14 kt tonnes CO2 equivalents.
Updates in accordance with any recalculation of the GHG inventory, as appropriateb
This is the first time the reference level is reported in accordance with the MPGs, hence there are no updates. The value of the reference level has been recalculated since Norway updated its NDC and may be updated in the future due to methodological improvements to the GHG inventory.
Relation to NDCc
The indicator is defined in the same unit and metric as the target of the NDC.
The total is reported in the CRT tables of Norway’s GHG inventory. The relevant total is «Total CO2 equivalent emissions, including indirect CO2, without LULUCF».
Any sector or category defined differently than in the national inventory report:
4. Land use, land-use change and forestry
For the LULUCF sector, only a subset of emissions and removals are included through them being identified as additional removals and emissions. There is ongoing work to clarify this method.
Definition needed to understand mitigation co-benefits of adaptation actions and/or economic diversification plans:
Adaptation actions
Not applicable
Economic diversification plans
Not applicable
Any other relevant definitions
NA
For the emissions and removals from the LULUCF sector, additional emissions and removals in this sector will be accounted for towards the target.
Norway expects that the cooperation with the EU will be reflected through transfer of ITMOs based on net flow of allowances between EU and Norway in the ETS and possibly any flows of units under the pillars ESR and LULUCF. In the event that this cooperation does not fully realize the NDC target of at least 55, Norway will also use ITMOs acquired from countries outside the European Economic Area through its purchase program.
2.4.1.2 Methodologies and accounting approach
Norway will use the following accounting approach for tracking progress towards its NDC: Annual total CO2 equivalent emissions, including indirect CO2, without LULUCF are compared to the economy-wide absolute emission reduction as defined in the NDC.
For the emissions and removals from the LULUCF sector, the Government has not yet identified the concrete method that will be used to account for the additional emissions and removals. There is ongoing work to clarify this method.
The figures reflecting GHG emissions are then adjusted for any net transfers of ITMOs between Norway and the EU and between Norway other Parties. Norway’s emissions balance would reflect the level of emissions and removals covered by its NDCs and adjusted using corresponding adjustments.
Details on methodologies and accounting approaches consistent with the accounting guidance18 under the Paris Agreement can be found in CTF table 3 (‘Methodologies and accounting approaches’), which has been submitted electronically together with this BTR.
The national GHG inventory represents the starting point for accounting towards the 2030 single year target. Norway will also cooperate with other countries under Article 6; notably cooperation with the EU under Article 6.2, but also cooperation with other countries.
Norway will report on how it will account for the use of ITMOs towards its single year 2030 target in a forthcoming Initial Report pursuant to Decisions 2/CMA.3 and 6/CMA.4. Given that the pillars in the cooperation with the EU form budgets that can be seen as trajectories towards emissions levels in the target year, Norway sees the possibility of using a trajectory or trajectories in accordance with the guidance in decision 2/CMA.3 Annex para 7 a i. The pillars in the EU legislation are designed to realize an overall reduction of at least 55 per cent in 2030. EU and Norway have individual NDCs with single year targets individually accounted for. For Norway implementing the requirements under the pillars and reflecting ITMO flows through an Article 6.2 cooperative approach may, however, not ensure that Norway fully realizes a reduction of 55 per cent.
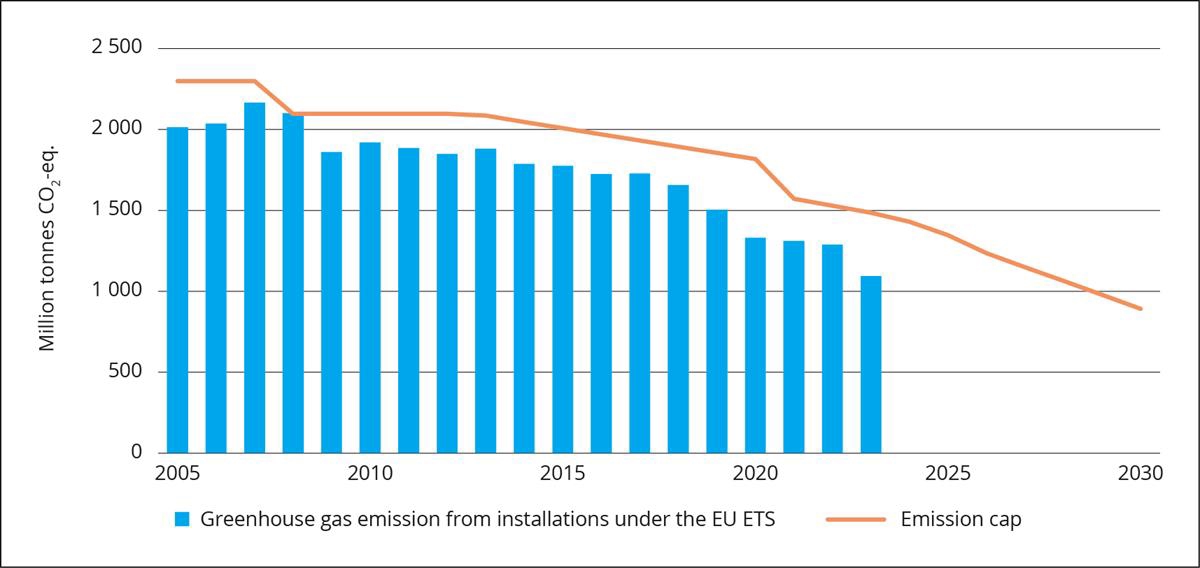
Figur 2.6 Greenhouse gas emissions and cap in the EU emission trading scheme (EU ETS)
Source: Ministry of Climate and Environment
Tabell 2.5 The Norwegian budget for ESR emissions (million tonnes CO2 equivalents)
2021
2022
2023
2024
2025
2026
2027
2028
2029
2030
2021-2030
ESR Budget 50 per cent reduction
25.2
24.3
23.1
21.8
20.6
21.2
19.5
17.8
16.1
14.5
204.1
Actual GHG emissions
25.5
25.2
24.1
-
-
-
-
-
-
-
226.0
Projected GHG emissions
23.5
22.8
22.2
21.7
21.1
20.2
19.6
Gap – 50 per cent reduction
0.3
0.9
1.1
1.7
2.2
1.1
2.2
3.3
4.1
5.1
21.9
In the calculation of the emissions gap, it is assumed that the EU will allow the accounting of negative emissions from carbon capture and storage under the effort sharing. If the EU does not allow this, the emissions gap will increase by approximately 0.7 million tonnes of CO2 equivalents.
Source: Government’s Climate Status and Plan for 202519
For the ETS there is one trajectory common for all of the EEA trading partners. This trajectory will reduce the cap – the annual volume of allowances – by 62 per cent compared to 2005 levels in 2030. If we were to apply the trajectory of the overall cap to Norway, its emissions from stationary sectors included in the system would be reduced to about 10 Mt in 2030. It is expected that Norway and the EU will develop rules guiding transfers of ITMOs pursuant the net flow of EUAs acquired and used in the ETS. Such an arrangement was already made under the Kyoto Protocol for 2008–2012 and 2013–2020, see documentation here; Norway’s multilateral assessment | UNFCCC; in particular chapter 4.5 in Norway’s fifth biennial report and relevant review reports.
The emission reduction target for Norway under the Effort Sharing Regulation (ESR) is expected to be a 50 per cent reduction in 2030, also compared to 2005 levels. The resulting emissions level would be 14.5 Mt in 2030, see Table 2.5. If the ESR trajectory is not fully realized through domestic emissions reductions as reflected in the inventory and other forms of flexibility (use of EUAs), there will be a need to acquire units from EU/EEA countries. It is envisaged that any net transfer of such units would be mirrored by transfers of ITMOs.
The trajectories for ETS plus ESR would result in a level of 24.5 Mt in 2030, corresponding to a reduction of 52.5 per cent.
Further, Norway will account additional domestic emissions and removals from the LULUCF-sector towards the target. Any net transfer or acquisition of LULUCF units within the EU/EEA cooperation may also be reflected as ITMO transfers and could thus be accounted for towards the target, subject to agreement with the EU on the matter.
2.4.1.3 Structured summary, status of progress
The key information for tracking progress towards achieving the NDC target is the most recent information on GHG emissions and removals in the scope of the NDC. Table 2.6 (CTF table 4 Tracking progress made in implementing and achieving the NDC under Article 4 of the Paris Agreement) summarises the current status of progress.
Tabell 2.6 (CTF table 4) Structured summary: Tracking progress made in implementing and achieving the NDC under Article 4 of the Paris Agreement
Unit, as applicable
Reference point(s), level(s), baseline(s), base year(s) or starting point(s), as appropriate (paras. 67 and 77(a)(i) of the MPGs)
Implementation period of the NDC covering information for previous reporting years, as applicable, and the most recent year, including the end year or end of period (paras. 68 and 77(a)(ii–iii) of the MPGs)
Target levelb
Target year or period
Progress made towards the NDC, as determined by comparing the most recent information for each selected indicator, including for the end year or end of period, with the reference point(s), level(s), baseline(s), base year(s) or starting point(s) (paras. 69–70 of the MPGs)
1990
2021
2022
Indicator(s) selected to track progress of the NDC or portion of NDC under Article 4 of the Paris Agreement (paras. 65 and 77(a) of the MPGs):
Emissions without LULUCF
kt CO2 equivalent
51 263.14
49 254.43
48 879.49
23 068.41
2030
The most recent level of the indicator reported in the NIR is 4.7 per cemt below the base year level. Preliminary estimate for 2023 is 9.1 per cent lower than in the base year. Information on ITMOs pursuant to Article 6 cooperative approaches will be submitted in future BTRs when such approaches have been agreed between Norway and other parties.
Where applicable, total GHG emissions and removals consistent with the coverage of the NDC (para. 77(b) of the MPGs)
kt CO2 equivalent
49 254.43
48 879.49
Contribution from the LULUCF sector for each year of the target period or target year, if not included in the inventory time series of total net GHG emissions and removals, as applicable (para. 77(c) of the MPGs)
kt CO2 equivalent
NE
NE
Each Party that participates in cooperative approaches that involve the use of ITMOs towards an NDC under Article 4 of the Paris Agreement, or authorizes the use of mitigation outcomes for international mitigation purposes other than achievement of the NDC, shall provide (para. 77(d) of the MPGs):
NA
NA
Information on ITMOs pursuant to Article 6 cooperative approaches will be submitted in future BTRs when such approaches have been agreed between Norway and other parties, where the largest volume is expected to reflect cooperation with the EU on the ETS. For this BTR1, there is not yet any information to report in this table.
It is a priority for Norway to clarify the method for identifying additional removals and emissions from the LULUCF-sector, both for planning purposes and to reflect the contribution fully in future BTRs. Since the methodology to document additional emissions and removals in the LULUCF sector is not yet developed, the contribution from the LULUCF sector is reported as not estimated (NE) in the years 2021 and 2022.
Based on Norway’s GHG inventory data, the emissions without LULUCF in 2022 were 4.7 per cent lower than the base year emissions in 1990. Preliminary estimates of the emissions in 2023 that have not yet been reported to the UNFCCC indicate that the emissions without LULUCF have decreased further and were 9.1 per cent lower than in 1990.
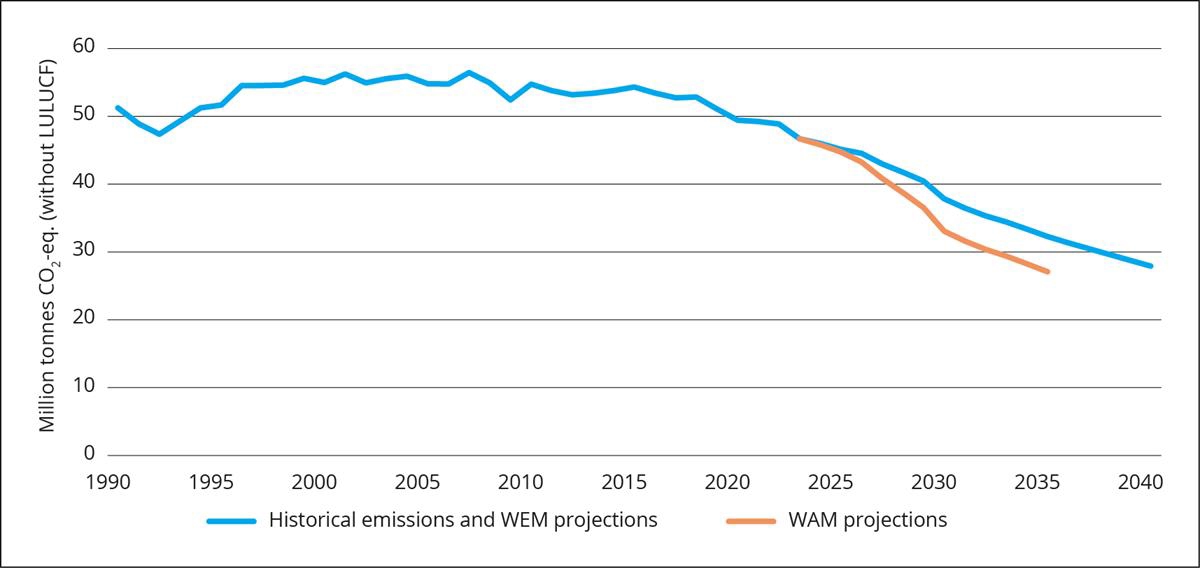
Norway has selected the indicator «emissions without LULUCF» as the indicator representing the point of departure in tracking progress towards the implementation and achievement of Norway’s NDC. This includes the emissions of indirect CO2. Norway’s with existing measures (WEM) projections (see chapter 2.7) shows that emissions without LULUCF could decrease to a level of 26.2 per cent lower than in 1990. Table 2.7 shows the projected values for Norway’s key indicator and these are identical to the values in the WEM projections without LULUCF.
Tabell 2.7 (CTF table 10) Projections of key indicator
Key indicator(s)c
Unit, as applicable
Most recent year in the Party`s national inventory report, or the most recent year for which data are available
Projections of key indicators
2022
2025
2030
2035
2040
Emissions without LULUCF
kt CO2 quivalent
48 879.49
45 137.64
37 842.04
32 283.55
27 915.49
Notes: The Party could add rows for each additional key indicator.
Further mitigation actions are planned and the with additional measures (WAM) projections (see chapter 2.7.6) show that domestic emissions without LULUCF could decrease 4.8 Mt further to a level of 35.5 per cent lower than in 1990. These 4.8 Mt refer to measures in the sectors covered by the ESR and would bring Norway closer to realizing the ESR budget. The government aims to close any remaining ESR gap with units acquired from EU countries. The government has set aside funding for such acquisitions and is exploring possible supply.
Assuming that the ESR target is met, emissions from the ETS sectors would represent the bulk of the remaining gap between actual emissions and the NDC target. Norway expects most, if not all of this gap to be covered by ITMOs representing a net flow of allowances between EU and Norway within the ETS. Additional removals and emissions from the LULUCF sector will also be accounted for towards the target. In the event that these contributions do not fully realize the target, Norway will account for ITMOs from countries outside the EEA. Funding for such acquisitions is available through the state budget; see Norwegian Global Emission Reduction Initiative – regjeringen.no. Note that an annual emissions balance consistent with chapter III.B (Application of corresponding adjustment) will be provided in a subsequent BTR, based on the annual information that will be reported under Article 6.2. For expected content in such forthcoming reports, see the previous subchapter.
2.5 Mitigation policies and measures, actions and plans
2.5.1 Introduction
The main instruments of Norwegian climate policy are cross-sectoral. This includes taxes on greenhouse gas emissions and emissions trading. Use of these instruments will contribute to fulfilment of emission targets at lowest cost to society. In addition to instruments that put a price on emissions, the Government uses other policy instruments to reduce barriers and correct market failures related to technology development, and in specific markets. An effective transition requires combinations of measures. Pricing emissions forms the basis as a continuous incentive to reduce emissions. Since most climate measures face multiple barriers, a single measure is rarely sufficient. Support for research and technology development is important to bring about necessary new solutions for emission cuts, and taxes and regulations can be crucial to ensure that such solutions are actually implemented. Notification of regulation, in combination with support during a transition period, can be particularly effective, as support can accelerate the impact of announced requirements and additionally increase acceptance of such requirements.
This chapter describes some of the most important policies and measures (PaMs) for reducing greenhouse gas emissions in Norway. The chapter consists of textual descriptions of cross-sectoral and sectoral PaMs. Information on PaMs is also presented in CTF table 5 in accordance with decisions 18/CMA.1 and 5/CMA.3. PaMs with a * in CTF table 5 are considered to be reflected in the WEM-projection while the PaMs described in chapter 2.5.11 are included in the WAM-projection. Annex 3 of this BTR describes the methodologies and assumptions used to estimate the GHG emission reductions or removals and where relevant information related to costs, non-GHG mitigation benefits and how the mitigation actions interact with each other.
2.5.2 Cross-sectoral
The Norwegian system of pricing GHG emissions
Important instruments of Norwegian climate policy are taxes on greenhouse gas emissions and emissions trading. Both these instruments put a price on emissions and make it more expensive to release greenhouse gases. Taxes provide an incentive to reduce emissions both through immediate action and through investment in research and development that will make it possible to reduce emissions at a later date. Cross-sectoral economic policy instruments (climate taxes) form the basis for decentralized, cost-efficient and informed actions, where the polluter pays.
CO2 taxes on mineral oil, petrol and emissions from petroleum extraction on the continental shelf were introduced in 1991 to cost-efficiently limit greenhouse gas emissions. In addition to being subject to CO2 taxes, emissions from extraction of petroleum were also included in the European emission trading system (EU ETS) in 2008. CO2 taxes on natural gas and LPG were introduced in 2010.
In Norway, taxes on GHG emissions and quotas (EU ETS) cover approximately 85 per cent of greenhouse gas emissions. The system of taxes on GHG emissions consists of the CO2-tax on mineral products (petrol, mineral oils, natural gas and LPG), the CO2-tax on petroleum activities on the continental shelf, the tax on HFC and PFC, the tax on waste incineration and the tax on SF6. The different taxes are harmonised, and in 2024, the standard tax rate on non-ETS emissions is 1 176 NOK per tonne. The tax rate on non-ETS emissions in the tax on waste incineration is 75 per cent of the standard rate for non-ETS emissions.
The price on greenhouse gas emissions varies between sectors and sources. The price on emissions is highest in the petroleum sector and in domestic aviation, which are also part of EU ETS. Both sectors are subject to taxes in addition to the EU ETS, and the total price on emissions is approximately NOK 1,500 per tonne of CO2 in 2024. Emissions of methane or nitrous oxide from agriculture is not a part of the EU ETS, nor is it subject to tax on. However, standard rates of CO2 tax and base tax on mineral oils apply to agriculture.
If natural gas and LPG is used in land-based manufacturing covered by EU ETS, the tax rate will either be reduced, or the activities may be exempted from the tax. For the time being, other sectors and activities exempted from the CO2 tax on natural gas and LPG include (list not conclusive) fishing in distant waters, chemical reduction or electrolyses, metallurgical and mineralogical processes and international shipping and aviation. In the 2025 budget, it is proposed to introduce a reduced and separate tax rates for emissions from fishing in distant waters and international shipping. The Norwegian parliament has adopted a tax on chemical reduction etc., but the tax will only be put into effect in the case where an exemption for emissions covered by the ETS is accepted by The EFTA Surveillance Authority (ESA).
Overall price levels have increased due to increases in the tax rates and the increase in the price of allowances in the EU ETS. In the period 2020 to 2023, the reduced rate for fisheries in domestic waters has been abolished, a new tax on emissions from waste incinerations is introduced, the CO2 tax on mineral products has been expanded to include emissions from the greenhouse industry and there is introduced a tax on SF6. It is further proposed base extensions for 2025.
Some taxes that do not target greenhouse gas emissions directly nevertheless increase the total tax on fossil fuels and therefore affect emissions. The road usage tax on fuels is levied to internalise the costs inflicted on the society in terms of accidents, congestion, noise, road wear and tear as well as health and environmentally harmful emissions other than CO2. In recent years, the road usage tax has been reduced to compensate drivers for the increased CO2 tax.
PaM cross-sectoral No. 1
The CO2-tax on mineral products (excluding road transport and air transport under the ETS)
The standard tax rate on emissions under the ESR is NOK 1 176 in 2024. The tax covers close to 100 per cent of all use of fossil fuels covered by the ESR.20
The CO2-tax on emissions from road transport and emissions from aviation covered by the ETS are treated as separate policies and reported under transport below.
PaM cross-sectoral No. 2
EU Emissions Trading System (ETS)
Norway established a national emissions trading scheme in 2005. Most features of the scheme closely resembled the EU’s emissions trading scheme (EU ETS) and covered 11 per cent of total Norwegian greenhouse gas emissions, mainly from industry. Emissions already subject to CO2 tax were not included in the scheme.
From 2008 Norway became part of EU ETS phase II, which broadened the scheme to cover nearly 40 per cent of Norwegian greenhouse gas emissions. The petroleum sector and emissions from industries that had previously been subject to CO2-taxes were included in the EU ETS at that stage. In addition to the sectors included in the EU ETS, Norway decided unilaterally in February 2009 (effective from 1 July 2008) to include nitrous oxide emissions from the production of nitric acid in Norway. Such emissions constituted about 4 per cent of Norwegian greenhouse gas emissions in 2005. Further installations and gases were included in ETS III as of 2013.
From 2021, phase IV (2021–2030), there is no change in the coverage of sectors and gases compared to phase III for stationary installations. Emissions covered by the EU ETS in this phase amounts to about 50 per cent of the Norwegian emissions. In July 2021, as part of the Fit for 55 legislative package, the European Commission proposed a comprehensive set of changes to Phase IV of the EU ETS, for instance an increased level of ambition and extending the scope of the scheme to cover maritime transport. In addition, the Commission proposed to create a new, separate emissions trading system named ETS2 for CO2 emissions from fuel combustion in buildings, road transport and additional sectors (mainly small industry not covered by the existing EU ETS). The updated ETS directive applies to Norway, starting January 2024.
Cap
Norway participates in the EU ETS. The aggregated future emissions covered by the scheme cannot exceed the EU-wide cap, which was set 21 per cent lower in 2020 compared with the emissions in 2005 from the covered sectors. Norwegian installations represent about 1 per cent of the total emissions. Norway’s participation in the ETS from 2008 led to a tightening of the system, as Norwegian installations have had a higher demand for allowances than the number of allowances added pursuant to this expansion of the system. The reduction rate for the cap was further increased from 2021 so that overall reduction of the cap in 2030 will be 62 per cent compared to 2005.
Legal basis
The legal basis for emissions trading in Norway is the Greenhouse Gas Emissions Trading Act which entered into force on 1 January 2005. The Act has been amended several times since 2005 to reflect the developments in the EU ETS Directive. The Greenhouse Gas Emissions Trading Act provides the legal framework, while the detailed provisions are in the Norwegian Greenhouse Gas Emissions Trading Regulation.
Allocation and emissions
In the first (2005–2007) and second (2008–2012) phases of the EU ETS, allowances were allocated based on rules developed nationally (see NC6). The average amount of Norwegian emissions covered by EU ETS was 6 and 19.1 Mt/year in the respective phases. Up to and including 2020, the EU ETS allowed for the use of Kyoto units from the Clean Development Mechanism (CERs) and Joint Implementation (ERUs) for compliance purposes. A total volume of about 15 million CERs and ERUs have been surrendered from the installations for their compliance. Both during the first and the second commitment period under the Kyoto Protocol, there was a significant net transfer of Assigned Amount Units (AAUs) between EU and Norway corresponding to net purchases by Norwegian installations in the European market. The transferred AAUs have been used for compliance Together with the volumes of Kyoto units surrendered by installations in the ETS, this volume of AAUs closed almost all the gap between actual emissions and the commitments. It will be necessary to apply a similar clearing mechanism between EU and Norway under the Paris Agreement.
Installations in sectors that are considered to be at risk of carbon leakage receive some or all of their allowances free of charge. Since 2013, the allocation methodology has been harmonized across Europe. The general rule for allocation free of charge is based on performance benchmarks rather than historical emissions levels.
Another measure aiming at preventing carbon leakage is that specific industries affected by higher electricity prices caused by the allowance price, since 2013 can be granted economic compensation (see chapter 2.5.7).
Compliance and reporting requirements
Operators have in general been in compliance with the requirements of the ETS. Those included within the scope of the emissions trading scheme must report their verified emissions yearly to the Norwegian Environment Agency by 31 March the following year. If an operator does not submit an emission report in accordance with the provisions on reporting by the deadline, the Norwegian Environment Agency suspends the operator’s right to transfer allowances to other account holders. Emissions reports from Norwegian installations must be verified by an accredited third party (verifier).
The Norwegian Environment Agency may impose coercive fines and even penal measures in the event of serious contravention of the provisions in the Greenhouse Gas Emissions Trading Act. A fine for failure to comply is imposed if an insufficient number of allowances is surrendered by 30 September. In addition, the operator must surrender an amount of allowances equivalent to the deficit the following year.
The operators of installations to which free allocation has been given, must report their verified allocation data yearly to the Norwegian Environment Agency by 31 March. Where the report shows that there has been changes in the activity of the installation, the Norwegian Environment Agency adjusts the allocation accordingly.
PaM cross-sectoral No. 3
EU Emissions Trading System 2 (ETS2)
As part of the 2023 revisions of the ETS Directive, a new emissions trading system named ETS2 was created, separate from the existing EU ETS. This new system will cover and address the CO2 emissions from fuel combustion in buildings (including construction), road transport and additional sectors (mainly small industry not covered by the existing EU ETS).
The ETS2 is meant to help states achieve their emission reduction targets under the Effort Sharing Regulation (ESR) and the GHG emission price set by the ETS2 will provide a market incentive for investments in building renovations and low-emissions mobility.
The ETS2 will become fully operational in 2027. Although it will be a ‘cap and trade’ system like the existing EU ETS, the ETS2 will cover emissions upstream. It will be fuel suppliers, rather than end consumers such as households or car users, that are regulated under the ETS2, which means they are required to monitor and report their emissions. Eventually they will be required to surrender sufficient allowances to cover their emissions. Regulated entities will purchase these allowances at auctions. The ETS2 cap will be set to bring emissions down by 42 per cent by 2030 compared to 2005 levels in the EU. In case of exceptionally high gas or oil prices in 2026, the start of the ETS2 system could be postponed to 2028 to ensure a smooth implementation.
Compliance and reporting requirements
Regulated entities covered by the ETS2 are required to hold a greenhouse gas emissions permit by 1 January 2025, as well as an approved monitoring plan for the monitoring and reporting of their annual emissions. Monitoring plans form part of greenhouse gas emissions permits.
Every year, regulated entities must submit an emissions report by 30 April for the emissions of the previous year. From 2026, the data for a given year will have to be verified by an accredited verifier.
From 2028, once annual verified emissions are reported, regulated entities will have to surrender the equivalent number of allowances by 31 May of that year to cover emissions that took place the previous year.
Legal basis
Parts of the ETS2 have been transposed into Norwegian law, while other parts are in the process of being transposed. Requirements regarding the need to hold a greenhouse gas emissions permit by 1 January 2025 and most monitoring and reporting requirements are reflected in the Norwegian Greenhouse Gas Emissions Trading Regulation, with the Pollution Control Act providing the legal framework.
An amendment to the Norwegian Greenhouse Gas Emissions Trading Act (and a subsequent amendment of the Norwegian Greenhouse Gas Emissions Trading Regulation) is needed to implement the remaining parts of the ETS2, notably the requirement to surrender sufficient allowances, into Norwegian law.
The ETS2 and national CO2 tax
Under the ETS directive, as amended for the EEA EFTA states, regulated entities in the ETS2 may be exempted from the obligation to surrender allowances if they are subject to a national CO2 tax in force for the years 2027 to 2030. Norway has notified ESA of the Norwegian national CO2 tax, which if approved, would be the first of many steps to apply such a derogation to regulated entities in Norway. In the case that such a derogation is not applied, it is not yet determined if and/or how the national CO2 tax could be affected.
Other cross-sectoral policies and measures
PaM cross-sectoral No. 4
Regulation by the Pollution Control Act
The Pollution Control Act (Nw. forurensningsloven) lays down a general prohibition against pollution. Pollution is prohibited unless specific permission is granted by law or by a decision made by the relevant authority. The Pollution Control Act also applies to greenhouse gas emissions. Greenhouse gas emissions are, however, to a large extent covered by other specific policy instruments such as the CO2 tax, the EU ETS and specific agreements with the industry on emission reductions.
The Act includes provisions aimed at ensuring the effective enforcement of its regulations and decisions. For example, breaching these provisions may result in closure, coercive fine or criminal liability.
In the waste sector, regulations under the Pollution Control Act ensure minimum environmental standards for landfills and incineration plants, and regulate the handling of specific waste fractions. The EU directives on waste are implemented through the Pollution Control Act and various sections of the Waste Regulation (Nw. avfallsforskriften). The Waste Regulation includes the following measures:
Requirement to collect methane from landfills (gradually introduced from 1998).
Prohibition of depositing biodegradable waste (introduced 1 July 2009 with an opening for exemptions until 2013).
Requirement to utilise energy from incineration from incineration plants.
Since 2002, landfilling of wet-organic waste has been prohibited. In 2009, this prohibition was expanded to include all biodegradable waste.
The Waste Regulation stipulates that incineration plants should be designed and operated to utilise the thermal energy generated as far as practically feasible. This is typically enforced through plant concessions by including a condition that at least 50 per cent of the energy generated from the incineration should be utilised.
PaM cross-sectoral No. 5
The Planning and Building Act
The Planning and Building Act sets the framework for the planning and use of land areas and building requirements. The vast majority of decisions to change land use are made by municipalities through the Planning and building act. Planning pursuant to the Act shall ensure sustainable development for the whole country and requires the participation of all those that are concerned by the decisions made in accordance with the Act.
The Act is a process law, regulating how decisions concerning land use and building must be made, as well as outlining some core topics that must be taken into consideration in decisions made in accordance with the Act. The legislative purpose of the Act is to ensure sustainable development in the interest of individuals, society and future generations. Among the core planning functions and considerations required in all planning in accordance with the Act, are climate change mitigation and adaptation.
The national government is currently assessing possible changes in the Act with regards to climate. The government is also in the process of revising central government planning guidelines (Statlige planretningslinjer) to clarify and strengthen the requirements for how to take climate into account in plans made in accordance with the Act.
PaM cross-sectoral No. 6
Enova
Enova is a state-owned enterprise, owned by the Ministry of Climate and Environment. Enova is managed by the ministry based on four-year agreements. The current agreement is valid until the end of 2024, and a new agreement will come into effect in 2025.
In recent years, Enova has become one of the most important policy tools for new solutions within the climate and energy transition. The current agreement states that Enova’s purpose is to contribute to Norway’s emissions reductions commitment and contribute to Norway’s transition to a low-emission society. In the new agreement period, Enova will also contribute to an efficient energy transition that supports the goals and initiatives of climate and energy policies, as well as innovation in climate and energy solutions. Enova currently contributes towards reducing non-ETS emissions towards 2030, and developing technology and innovation that contribute to reducing emissions to bring us to a low-emission society in 2050.
Enova provides funding and advice for climate and energy projects, and supports various sectors. Funding for projects is drawn from the Climate and Energy Fund, which was provided NOK 8.6 billion in 2024. The four-year agreements between Enova and the Ministry through the Climate and Energy Fund provides Enova with a significant degree of freedom and flexibility to respond quickly to new opportunities and to support those projects that offer the greatest opportunities to influence developments. Given uncertainties about the speed of technology developments in various sectors, freedom and flexibility within the framework of the four-year agreement is important.
Enova’s activities focus on late-phase technology development and early-stage market introduction. Grants for late-phase technology development help to speed up the pace and scale of pilot and demonstration projects and full-scale testing, so that new technologies and solutions reach the market more quickly. Enova’s programs deal with technologies and solutions at various stages of maturity. During the innovation process from technology development to market introduction, the goal is to reduce costs and the level of technological risk. Once a solution is technologically mature and ready for market roll-out, the goal is to achieve widespread deployment and market take-up. It is always necessary to overcome various market barriers as a solution proceeds through technology development and market introduction. Enova seeks to identify the most important of these and designs its programmes for the introduction and deployment of energy and climate solutions to lower such barriers.
New climate and energy technology developed in Norway can also play a part in reducing greenhouse gas emissions at the global level when deployed widely enough. Investment in new technology and innovation often carries a high level of investment risk. Using public funding to reduce risk is an important strategy, since new technologies often provide greater benefits for society than for individual investors.
It generally takes time for new technologies or solutions to become established and diffuse through the market. The reasons for the delay may vary. Possible barriers to the spread of new technologies and products include a lack of information, scepticism to new and relatively untried solutions, and costs. Enova’s programmes for market change are designed to reduce these and other barriers and thus promote permanent market change.
PaM cross-sectoral No. 7
Klimasats
In 2016, the Solberg Government introduced a financial support scheme to promote emissions reduction projects in Norwegian municipalities and counties. The scheme is called Klimasats («Climate leap») and is administered by the Norwegian Environment Agency that assesses and prioritises the applications based on given criteria. The objective of Klimasats is to reduce emissions at the local level and contribute to the transition to a low emission society.
A recent analysis21 (2024) by the Norwegian Environment Agency shows that municipalities play a key role in the transition to a low-emission society, and reducing national emission. Klimasats is a suitable scheme to support municipalities in this work and has supported projects with immediate emission reductions from transport, waste handling, buildings and public procurement. Examples of supported projects are the use of climate friendly building materials in public buildings, reduction of food waste in local institutions and zero emission construction sites. It also supports a wide range of projects aiding a more long-term transition to a low emission future through urban planning, capacity building and cross-sectoral cooperation.
From 2016 to 2024, the Klimasats funding scheme has partially funded more than 2200 municipal emissions reductions and green transformation projects throughout the country, with a total of 1.8 billion NOK. All projects can be found at the Norwegian Environment Agency’s website.22
PaM cross-sectoral No. 8
The environmental technology scheme – Innovation Norway
The Environmental Technology Scheme was established in 2010. The overall target of the scheme is to encourage the Norwegian industry to introduce new and better products and processes related to environmental technology to the market. The scheme aims at promoting profitable business opportunities and helping to realize Norway’s environmental goals.
In this context, the definition of environmental technology is all technology that directly or indirectly improves the environment, including technology and services that limits pollution through purification processes, more environmentally friendly products and production processes, more efficient handling of resources and technological systems that reduce the impact on the environment.
The Environmental Technology Scheme offers grants and other support for development and investments in pilot and demonstration projects for new Norwegian environmental technology.
It is a nationwide scheme to which all Norwegian companies can apply. The companies apply for grants related to the costs for planning and development of the project, investment costs during the development and pilot phase, and costs relating to start-up and testing after the initial work to establish the pilot. The criteria for receiving grants are related both to the projects’ economic and commercial effects, environmental effect and level of innovation.
In 2023, NOK 425.9 million was granted from the environmental technology scheme to 75 projects. Total investments in these projects (including the companies’ own funds) are NOK 2.2 billion. The projects are based across a range of different technologies, including energy systems, metallurgic industry, bio-refinery, renewable energy, water treatment, maritime sector and aquaculture.
PaM cross-sectoral No. 9
Nysnø Klimainvesteringer AS (Nysnø)
Nysnø Klimainvesteringer AS (Nysnø) is an investment company wholly owned by the Norwegian State, through the Ministry of Trade, Industry and Fisheries. Nysnø was established in December 2017 in order to contribute to reducing greenhouse gas emissions through investments with such an effect directly or indirectly. Nysnø invests in non-listed companies, and in funds aimed at non-listed companies that have operations in Norway. Nysnø focuses on early-stage companies and invests primarily in the transition from technology development to commercialisation. Nysnø has so far received NOK 5,382 million in capital. Capital and competence are drivers for developing and applying new technology for a low-emission society. Together with private investors, Nysnø provides both.
PaM cross-sectoral No. 10
Climate and environmental requirements for public procurements
From 2024, a regulatory requirement regarding public procurement came into effect. This mandates that climate and environmental considerations must generally be weighted with a minimum of 30 per cent in public procurements. Alternatively, climate and environmental requirements can be included in the specifications if it is clear that this will provide a better climate and environmental effect. The aim of the climate and environmental requirements is to reduce the GHG emissions or environmental impact of public procurements.A survey conducted by DFØ from 2024 shows a clear trend toward increased use of climate and environmental considerations in public procurement.23
2.5.3 Petroleum sector
Environmental and climate considerations are an integral part of Norway’s policy for the petroleum industry. A range of policy measures ensures that actors in the industry take environmental and/or climate considerations into account during all phases of their activities, from exploration to development, operations, and field cessation.
Environmental and climate standards in the Norwegian petroleum industry are very high compared with those in other petroleum producing countries. This is a result of effective policy instruments and joint initiatives between the authorities and oil companies on research, technology development and increased knowledge.
Emissions to air from petroleum activities originate from the combustion of natural gas and diesel in turbines, engines, and boilers, flaring of natural gas for safety reasons, venting of diffuse emissions of gas, and storage and loading of crude oil. These activities result in emissions of waste gas containing CO2, NOx (nitrogen oxides), NMVOCs (non-methane volatile organic compounds), CH4 (methane) and sulphur dioxide (SO2).
Emissions from Norwegian petroleum activities are regulated through several acts, including the Petroleum Act, the CO2 Tax Act on petroleum activities, the Sales Tax Act, the Greenhouse Gas Emission Trading Act and the Pollution Control Act.
Requirements for impact assessments and approval of plans for new developments (PDOs/PIOs) are cornerstones of the petroleum legislation. Facilities onshore and within the territorial waters are also subject to the provisions of the Planning and Building Act.
Emissions from the petroleum sector in Norway are well documented. The industry’s own organisation, the Norwegian Oil and Gas Association (NOROG), has established a national database for reporting all releases from the industry, called EPIM Environmental Hub (EEH). All operators on the Norwegian continental shelf report data on emissions to air and discharges to the sea directly in EEH.
PaM petroleum No. 1
Climate policies that affect the petroleum sector
The CO2 tax on petroleum activities on the continental shelf
The CO2 tax is levied on all combustion of natural gas, oil and diesel in petroleum operations on the continental shelf and on releases of CO2 and natural gas, in accordance with the CO2 Tax Act on Petroleum Activities. For 2024, the tax rate is NOK 1.85 per standard cubic metre of gas or 2.10 NOK per litre of mineral oil. For combustion of natural gas, this is equivalent to NOK 790 per tonne of CO2. Emissions of natural gas to the atmosphere is not subject to the ETS. The tax rate is NOK 16.89 per standard cubic metre, equivalent to the standard rate for non-ETS emissions of NOK 1 176 per tonne of CO2.
Emission Trading
Norwegian installations in the petroleum industry are included in the EU ETS, and subject to the same rules for emissions trading as those within the EU.
Emission allowances are allocated by auctioning or given free of charge. Sectors that are considered to be at risk of carbon leakage receive more of their allowances free of charge, following harmonised allocation rules. A certain proportion of the petroleum-sector emissions to which the ETS applies, is considered to be at risk of carbon leakage. Allowances for emissions from electricity generation on offshore installations are not allocated free of charge.
The combination of the CO2 tax and the emissions trading system means that emissions covered by the ETS on the Norwegian shelf, in 2024, face a price of approximately NOK 1 500 per tonne for their CO2 emissions, which is high compared to emission prices in other petroleum producing countries.
Other regulations
Routine flaring and venting of natural gas have been prohibited since 1971. Flaring of natural gas is only permitted when necessary for safety reasons. Permit for flaring are issued by the Ministry of Energy.
A permit under the Pollution Control Act is required for emissions to air from petroleum operations.
There is also requirements to use best available technologies (BAT). Technological developments influence what is regarded as BAT, which over time results in stricter requirements for use of technologies reducing emissions.
PaM petroleum No. 2
Indirect CO2 emissions from offshore and onshore NMVOC regulation
Emissions of non-methane volatile organic compounds (NMVOC) lead to indirect CO2 emissions as NMVOC oxidises to CO2 in the atmosphere. Measures taken to reduce the NMVOC emissions therefore also reduce CO2 emissions.
In 2023, the petroleum sector accounted for 17 per cent of the total NMVOC emissions, with 23 kilotonnes emitted. The NMVOC emissions in the petroleum sector in Norway peaked in 2001. Since then, there has been a decline of 91 per cent until 2023. From 1990, NMVOC emissions in the petroleum sector have been reduced by 82 per cent in total.
The NMVOC emissions in the petroleum sector are mainly from loading of crude oil offshore, with offshore storage as another important source. The petroleum sector’s share of total NMVOC emissions has decreased as a result of regulations and because oil production has been reduced by approximately 45 per cent from 2001 to 2020. Starting from 2001, emissions of NMVOC linked to offshore loading and storage of crude oil have been governed under the emission permit system, pursuant to the Pollution Control Act. Since 1 January 2003, all vessels have been required to install equipment for recovering NMVOCs (vapour recovery units, VRUs). A large proportion of the shuttle tankers operating on the NCS have integrated VRUs that are designed for a 100 per cent recovery rate, of which an estimated 80 per cent is recovered as VOCs in liquid form (LVOC) and where almost 100 per cent recovery rate is achieved by incineration of residual NMVOC and methane in a steam boiler or gas turbine for energy production in the plant.
Several fields on the Norwegian Continental Shelf employ floating storage installations. This type of installation may produce higher emissions of NMVOCs than fields where the oil is stored in the base of the platforms (Statfjord, Draugen and Gullfaks). This is because, in the case of floating storage installations, the need to gas-free the tanks for inspections.
Regulations onshore are based on the Industrial Emission Directive (2010/75/EU) and corresponding BAT conclusion 2014/738/EU. Loading of crude oil and other hydrocarbons has been governed under the emission permit system, pursuant to the Pollution Control Act. A vapour recovery unit (VRU) for NMVOCs was in operation at the crude oil terminal at Sture in 1996. The VRU at Mongstad crude oil terminal came into operation in June 2008. On the Nyhamna gas processing plant, gas displaced from loading condensate cargo tanks of the ship is returned to a VRU, which has has been in operation since start-up of the gas processing plant in 2007. At the Kårstø gas processing plant, gas return from condensate loading is burned in an incinerator.
2.5.4 Carbon capture and storage (CCS)
The Norwegian government will continue its work on promoting CO2 management as a global climate mitigation tool. The Norwegian Government’s CCS policy spans activities from research, development and demonstration to large-scale projects and international work promoting CCS.
CCS comprises capture, transport and permanent geological storage of CO2 emissions from fuel combustion, industrial production and waste incineration. According to the findings of the Intergovernmental Panel on Climate Change (IPCC), CCS is a key measure for reducing global greenhouse gas emissions. Technology development in an international perspective and ways of reducing costs are key to the deployment of CCS at a global scale.
Norway has decades worth of experience with environmentally safe CCS. Since 1996, CO2 from natural gas production on the Norwegian Continental shelf has been captured and reinjected into sub-seabed formations in the Sleipner and Snøhvit petroleum fields. Nearly one million tonnes of CO2 per year have been separated during processing of natural gas from the Sleipner Vest field and stored in the Utsira formation. Since 2014, CO2 from natural gas production at the Gudrun field has also been separated out at the Sleipner Vest platform and stored there.
Since 2008, the Snøhvit LNG facility on Melkøya has separated CO2 from the well stream before the natural gas is chilled to produce liquefied natural gas (LNG). The CO2 is transported back to the Snøhvit field by pipeline and injected into a subsea formation. During normal operations, up to 700 000 tonnes of CO2 is stored annually.
PaM CCS No. 1
Carbon capture and storage (CCS)
CO2 Technology Centre Mongstad (TCM)
The Technology Centre Mongstad (TCM) is the world’s largest facility for testing and improving CO2 capture technologies. TCM has been operating since 2012, providing an arena for targeted development, testing and qualification of CO2 capture technologies on an industrial scale. It is a collaborative project between the Norwegian Government, Equinor, Shell and Total. From 2012 to 2017 the South African Company Sasol was a partner. It was designed for long-term operation, with two plants testing two different CO2 capture technologies: Amine technology, in which CO2 is captured by scrubbing flue gas with a water-based solution of amines.
Ammonia technology, which uses chilled ammonia as the solvent for absorbing CO2 from the flue gas.
The TCM facility was designed to be versatile enough to test CO2 capture using flue gas either from the combined heat and power (CHP) plant or from the refinery at Mongstad. So far, the companies Aker, Alstom, Shell Cansolv, Carbon Clean Solutions, IoN Engineering and Fluor have used the test facility.
Research and technology development
In Norway, government funding for CCS research is provided through the CLIMIT programme and a Centre for Environmental-friendly Energy Research. The CLIMIT programme is a national programme for research, development and demonstration of technologies for capture, transport and storage of CO2 from fossil-based power production and industry. The programme supports projects in all stages of the development chain, from long-term basic research to build expertise to demonstration projects for CCS technologies. Projects under the CLIMIT programme have yielded important results for the development of CCS in Norway and internationally.
In addition, a Centre for Environment-friendly Energy Research for CCS, NCCS, has been established. The centre is co-financed by the Research Council of Norway (governmental agency), industry and research partners.
Large-scale CCS
A full-scale CCS demonstration project, Longship, for capture, transport and storage of CO2 is under construction in Norway. The Longship project is a central part of the Norwegian government’s policy for CO2 management, and part of Norway’s contributions to technology development and transfer (see chapter 4.4). Longship will be fully operational in 2025. The project consists of two Norwegian CO2 capture facilities, Hafslund Celsio (waste incineration) and Heidelberg Materials (cement), and a CO2 transport and storage solution, provided by Northern Lights Joint Venture (Equinor, Shell and Total). The Northern Lights project was ready to receive CO2 in 2024. In its first phase, the capacity is 1.5 million tonnes of CO2 stored annually for 25 years. In its second phase, the capacity is 5 million tonnes of CO2 stored annually. The CO2 will be stored on the Norwegian continental shelf. Northern Lights is working with industry with emissions around the North Sea, and has already signed commercial agreements with Ørsted in Denmark and Yara in the Netherlands for transport and storage of CO2.
The Longship project is a result of close cooperation between the Government and the industrial partners over many years. Gassnova, the state enterprise for CCS in Norway, is responsible for coordination of the entire CCS chain. The Government has funded the two above mentioned initial capture projects in Norway, as well as the storage facility.
In addition, the Government has awarded ten new exploration licenses for CO2 storage; nine in the North Sea and one in the Barents Sea.
In 2024, two studies on measures for carbon capture and carbon dioxide removal have been conducted. The government is considering temporary measures to reduce barriers and market failures in the value chain for CO2 management.
International support and activities
In order for CCS to play an effective role in climate change mitigation, international cooperation on developing and commercialising new technology is essential. Norway collaborates with relevant countries on both a bilateral and multilateral basis, and various regional and international fora. Examples of such fora are the North Sea Basin Task Force, The Clean Energy Ministerial, The Mission Innovation and The Carbon Management Challenge. Norway furthermore provides funding for CCS projects abroad in cooperation with other countries and through existing programmes and institutions (see chapter 4.4).
2.5.5 Energy and transformation industries
CO2 taxes and emission pricing through participation in the EU emissions trading system (ETS) raise the price of energy use that results in greenhouse gas emissions and encourage low-emission energy production.
The EU ETS also influences Norwegian electricity prices because Norway trades electricity with the rest of Europe. One of the effects of the EU ETS is to raise the cost of fossil electricity production in Europe, thus pushing up electricity prices. This has an effect on electricity prices in Norway as well, even though production is based on hydropower.
PaM energy No. 1
Electricity tax
A tax on consumption of electricity was introduced in 1951. At present, an excise duty is levied on electricity supplied in Norway regardless of whether the power is generated domestically or imported. Households, agriculture, service industries and the public sector are subjected to the ordinary rate. Electricity used in chemical reduction and in electrolytic, metallurgical and mineralogical processes, greenhouses and rail transport, as well as households and public services in the action zone in the county of Troms and Finnmark, is exempted from the electricity tax. Electricity used in other manufacturing industries, mining and quarrying, commercial shipping and district heating is subject to a reduced rate.
PaM energy No. 2
Electricity Certificate Act
1st January 2012 Norway and Sweden established a common market for electricity certificates. The goal of the two countries was to develop new electricity production based on renewable energy sources amounting to 28.4 TWh by the end of 2020. Sweden will finance 15.2 TWh and Norway 13.2 TWh. In May 2019 Norway and Sweden achieved the goal of 28.4 TWh. Sweden has established goal of an additional 18 TWh in 2030, which will be financed by Sweden. The new goal of 46.4 TWh was achieved in March 2021. The end date for the certificate scheme is 31st December 2035. In both Norway and Sweden renewable energy plants with an operating date after 31st December 2021 is not eligible for electricity certificates. The electricity certificate market is a constructed market in the sense that the demand for certificates arises from a statutory obligation for specified electricity users to purchase them. Sales of electricity certificates give power producers a supplementary income in addition to that derived from sales of electricity. For more information about the electricity certificate scheme, see the Norwegian Water Resources and Energy Directorate’s annual report for 2023 (in Norwegian only).
PaM energy No. 3
Energy requirements in the building code
The national building code (Byggteknisk forskrift – TEK17) is the main legal instrument for improving energy efficiency in new buildings and buildings subject to major rebuilds. The building code regulates total net energy need for space heating, cooling and hot water lower (kWh per m2 of heated floor area per year) for 13 different building categories. The building code further specify that installation of fossil fuel heating installations are not permitted, and that larger buildings (more than 1000 m2 heated usable floor space) must have flexible heating solutions.
PaM energy No. 4
Ban on the use of mineral oil for heating
In June 2018, the government adopted a regulation banning the use of mineral oil (fossil oil) for heating of buildings from 2020. The ban covers the use of mineral oil for heating in residential buildings, public buildings and commercial buildings. From 2022, the ban was extended to also cover temporary use of mineral oil for heating and drying on construction sites. The use of mineral oil for heating of agricultural buildings and hospital buildings with 24-hour continuous patient care are exempt from the ban until January 1, 2025. The purpose of the ban is to reduce greenhouse gas emissions from heating of buildings.
PaM energy No. 5
Bionova
Bionova was established in 2022 to contribute to climate measures in agriculture and ensure the transition to a more circular bioeconomy based on biological resources from land and sea. Bionova works to increase resource efficiency and circularity in the bio-based industries’ value chains by strengthening and coordinating efforts towards energy transition, GHG emission reductions and increased soil carbon sequestration and storage in biobased enterprises, including agriculture, forestry and aquaculture. Bionova includes the «Value added scheme for renewable energy and technology development», a continuation of the «Renewable Scheme», which aims to encourage farmers, forest owners and biobased enterprises to adopt low-emission technologies and to produce, use and supply bioenergy.
2.5.6 Transport
The transport sector accounts for about 1/3 of Norwegian greenhouse gas emissions, and around 2/3 of the ESR emissions. There are several measures in place that affect greenhouse gas emissions from the transport sector. The tax policy is central, and the CO2 tax, which is a cross-sectoral measure, is of great importance in the transport sector. In addition, the vehicle tax policy contributes to shifting vehicle demand towards low and zero emission vehicles. Norway also has a quota obligation for biofuels for road traffic. In addition, there are several other measures, such as Enova’s grant schemes and requirements in public procurement processes.
Boks 2.3 The Planning and Building Act and transport
The Planning and Building Act (PaM cross-sectoral No. 5) constitutes the legal framework for decisions on spatial planning and development patterns. The act establishes the legal basis for decisions that facilitate mobility development, including provision for private cars, buses, walking, and cycling. Central government planning guidelines for land use and transport emphasises that development patterns and transport system must be coordinated to achieve efficient solutions, so that the need for transport can be limited and climate- and environmentally-friendly modes of transport can be facilitated. The guidelines are currently under revision.
Norway has been particularly successful in the aforementioned shift from fossil fuel to zero emission vehicles (ZEVs). Over the past decades, Norway has implemented several measures to increase the ZEV share of car sales and in the total vehicle park. Norway introduced exemption for ZEVs from VAT-payment at purchase, and a registration tax structured progressively based on emissions (with lower taxes for lower emissions and a negative tax for the lowest levels). Both of these measures strongly incentivize the purchase of low-emission cars. In addition to purchasing incentives, Norway has over time implemented several measures in the usage of cars as well. Exemption from payments in tolling stations and on ferries, free parking and access to bus lanes have been some of the most important measures. Norway have also used our state agency Enova to help the transition by offering support schemes for purchasing ZEVs and home chargers. There have been several support schemes both for individuals and businesses.
The measures have been successful. ZEVs make up more than 90 per cent of new passenger car sales in the last couple of months. In 2023 they amounted to more than 80 per cent of new sales. In terms of the total fleet, ZEVs now amount to about ¼ of the passenger car fleet. Our estimates tell us that with adopted policies, the ZEV share of new sales will make up 100 per cent of new passenger car sales in 2027. This means that as new cars replace old ones, the entire fleet will eventually be ZEV.
Boks 2.4 The National Transport Plan
The National Transport Plan is submitted to the Storting (the Norwegian Parliament) as a white paper every four years. The white paper sets forth the Government’s national transport policy in terms of transport goals, strategies and priorities in a long-term perspective.
The National Transport Plan 2025–2036 (Report to the Storting (white paper) No. 14 (2023–2024)) was submitted to the Storting in March 2024. This is the seventh plan under the current planning system, covering all modes of transport. The plan presents policies and priorities within an economic frame for a twelve-year period and provides perspectives towards 2050 and 2060.
PaM transport No. 1
The CO2-tax on mineral products (road transport only)
Norway has several overlapping and impactful policies affecting emissions from road transport. The CO2-tax on mineral products, tax advantages and incentives towards the purchase of low and zero emission cars, a road usage tax levied on fuels and a biofuel sales mandate all affect emissions. Due to the overlap of these measures, the effect of one measure will depend on whether the other measures are present or not. Therefore, the total effect on emissions for all measures with a substantial effect on emissions from road transportation have been reported.
PaM transport No. 2
Road usage tax
The road usage tax on fuel was introduced in 1931. The intention of the tax, besides creating revenue, is to price the external costs of road transport, except emissions of CO2. CO2 emissions from road transport are priced by the CO2 tax on mineral products. The major external costs are congestion, noise, accidents, wear and tear and local emissions. The road usage tax applies to petrol, mineral oil, biodiesel, bioethanol, natural gas and LPG.
PaM transport No. 3
One-off registration tax based on CO2 emissions
The one-off motor vehicle registration tax was introduced in 1955. The initial intention of the tax was to slow down the import of foreign capital-intensive goods. Now the tax is regarded as a fiscal tax, but it has been used extensively to give economic incentives to choose low and zero emissions vehicles.
CO2 emissions was introduced in the tax base in 2007. The main reason for including CO2 emissions in the calculation of the registration tax was to reduce CO2 emissions from new cars. Since 2007 the registration tax has been shifted to place greater weight on CO2 emissions. The registration tax on cars now depends on the weight, CO2, and NOX emissions of the car. Changes in the motor vehicle registration tax towards a system that rewards vehicles with low CO2 emissions and penalizes vehicles with high emissions have contributed to reduced emissions from new cars.
From 1990, ZEVs were exempted from the one-off registration tax. An additional weight-component in the one-off registration tax was introduced in 2023, that also applies to electric vehicles.
Since 2011, the share of electric vehicles has increased rapidly, due to the tax advantages for electric vehicles. In 2023, 82 per cent of all new cars were electric.
PaM transport No. 4
Tax advantages for zero emission vehicles
Norway provides very strong tax incentives for zero emission vehicles (ZEVs), through the value added tax, the one-off registration tax and the road usage tax on fuels.
The value added tax is a general tax on the domestic consumption of goods and services which is intended to raise revenues for the central government. The standard rate of value added tax in Norway is 25 per cent and to most goods and services, including vehicles. Since 2001, ZEVs has been zero-rated in the value added tax. This gives a very strong incentive to choose ZEVs, but also a considerable revenue loss, as the share of ZEVs increases. Value added tax on the purchase of ZEVs over NOK 500,000 was introduced in 2023.
From 1990, ZEVs were exempted from the one-off registration tax (PaM transport No. 3). As the one-off-registration tax for an ICE, on average, is more than NOK 300 000, the exemption gives a very strong incentive to choose ZEVs, but also gives a considerable revenue loss, as the share of ZEVs increases. An additional weight-component in the one-off registration tax was introduced in 2023, that also applies to electric vehicles.
Electricity is not encompassed by the road usage tax (PaM transport No. 2). This gives an economic incentive for electric cars.
Tax expenditures are provisions of tax law, regulation, or practice that reduce or postpone revenue for a comparatively narrow population of taxpayers relative to a benchmark tax. In 2024, the estimated tax expenditures related to electric vehicles in Norway are NOK 28 billion.
PaM transport No. 5
CO2 tax on emissions under the ETS from domestic aviation
Emissions from the use of mineral oil in domestic aviation are subject to the CO2 tax on mineral products. Norway has, since 2001, imposed a CO2 tax on civil domestic aviation. Starting from 2012, most of the emissions from domestic aviation are also covered by the EU ETS. The exceptions from the ETS mainly apply to flights under 5,700 kg, certain flights performed in the framework of public service obligations and certain non-commercial flights. Emissions covered by the ETS pay a reduced tax rate of 674 NOK per tonne CO2 equivalent in 2024, while non-ETS emissions are subject to a tax of 1,176 NOK per tonne CO2 equivalent. Domestic aviation are subject to taxes in addition to the EU ETS, and the total price on emissions is approximately NOK 1,500 per tonne of CO2 in 2024.
PaM transport No. 6
Biofuel mandate for road transportation
Norway has a blending mandate for road transport that was introduced in 2009. In 2009 the blending mandate said that economic operators that sold liquid fuel for use in road traffic needed to sell at least 2.5 per cent biofuels as a share of the total yearly amount of fuel sold for road transport. The level on the blending mandate has been increased several times since 2009 and has been 19 per cent since 1 January 2024. In Norway ‘advanced biofuels’ is defined as biofuels that are produced from the feedstock listed in Part A and part B of Annex IX in the EU ILUC-directive (Directive (EU) 2015/1513). This definition of advanced biofuels differs from both the ILUC-directive and the Renewable Energy Directive (Directive (EU) 2018/2001), where only biofuels from feedstock listed in Part A are considered ‘advanced’.
As of January 1st, 2014, sustainability criteria must be met by all biofuels and bioliquids included in renewable energy obligations or government support schemes. The sustainability criteria are the EU criteria implemented in the Fuel Quality Directive and the Renewable Energy Directive. Norway aims to promote development of the value chain for advanced biofuels. Since January 1st 2014, the use of advanced biofuels in road traffic has double counted towards the quota obligation. In addition, a sub target was introduced on January 1st in 2017, saying that at least 0.75 percentage points of the quota obligation (without double counting) was to be met by the use of advanced biofuels. This sub target has been increased several times and today at least 12.5 volume per cent of the total amount needs to be advanced biofuel. Although the blending mandate for road traffic opens to use 6.5 per cent first generation biofuel, which is characterized by being cheaper and less sustainable, entities that sell liquid fuel normally choose to sell advanced biofuel in addition to the sub target because it counts double when reporting on traded volumes.
In addition to the quota obligation, the CO2 tax is levied on mineral products. This entails that petrol and diesel are subject to CO2 tax, whereas bioethanol, biodiesel and hydrogen are not. The volumes of biofuels in petrol and auto diesel have increased over time, and the traded volumes is expected to continue increasing due to higher blending mandates towards 2030.
PaM transport No. 7
Biofuel mandate for shipping
The blending mandate for shipping was introduced 1October 2023 and is 6 per cent. The blending mandate is only for using liquid advanced biofuels. The same definition of advanced biofuel and sustainability criteria apply as in road transport. The use of biogas as an alternative to natural gas to reduce emissions is not a part of the mandate. The mandate does not apply for foreign shipping.
PaM transport No. 8
Biofuel mandate for other sectors
The blending mandate for other sectors was introduced 1January 2023 and is 10 per cent and includes for example non-road machinery and agricultural & farming machinery. The blending mandate is only for using liquid advanced biofuels. The same definition of advanced biofuel and sustainability criteria apply as in road transport. Biogas is excluded from the mandate.
PaM transport No. 9
Biofuel mandate for aviation
On 1 January 2020, a requirement that 0.5 per cent of aviation fuel sold in Norway is advanced biofuels was introduced. The quota obligation applies to all suppliers of aviation fuel and covers all types of aviation fuels for both domestic and international flights. Fuel sold to flights carried out by military aircrafts, however, are exempted from the regulation due to technical requirements in the defence sector. The same definition of advanced biofuel and sustainability criteria apply as in road transport.
PaM transport No. 10
Pilot projects for zero emission construction sites
To speed up the introduction of zero-emission machines and vehicles on construction sites in the transport sector, the government established in 2021 a 6-year support scheme for increased use of zero emission equipment. With financial support from the scheme, the three main public road and railway infrastructure builders have established different pilot projects. The main objectives of the pilot projects are to speed up implementation, gain knowledge and experience, identify risks and potential barriers and support technology development. For 2024, 30 million NOK was granted by Parliament.
PaM transport No. 11
Urban mobility – urban growth agreements
Urban growth agreements are the government’s most important instrument for developing attractive urban areas with good mobility, and with less congestion, local air pollution, noise and greenhouse gas emissions. Efficient land-use, measures that reduce private car use and facilitating so that more people can walk, cycle, and use public transport are essential to achieve such development. The aim of the agreements is to stop growth in passenger transport by car – this is referred to as the zero-growth target.
The agreements ensure better coordination between the state and local authorities that are responsible for various measures and instruments, and they are concluded between the government, the municipalities and the county council in urban areas. So far, urban growth agreements are concluded for seven of the largest urban areas. These are Oslo and Akershus, the Bergen urban area, the Trondheim urban area, Nord-Jæren, the Kristiansand region, Nedre Glomma, and the municipality of Tromsø.
PaM transport No. 12
Maximum CO2 emissions from the coastal service Bergen-Kirkenes
The Ministry of Transport is the competent authority for issuing a licence for the Coastal Route from Bergen to Kirkenes, and for procuring sea transport services on the route. The current contracts with Hurtigruten Coastal AS and Havila Kystruten AS entered into force in 2021 and expires December 31, 2030.
The contract sets the limit for the maximum allowed CO2 equivalent emissions (CO2e) from the vessels serving the Coastal Route. The annual maximum allowed emissions are 162 000 tonnes of CO2eon average for the whole contract period. All vessels must also be equipped for receiving electric power from shore, which allows operation of the ship without the use of its own machinery when the ship is docked. Electric power from shore will be used in the ports where the infrastructure facilitates it. A maximum of 0.10 per cent sulphur content of the fuel weight used is required. It is also not permitted to use heavy oil as fuel.
In order to meet the environmental requirements of the contract, Havila Kystruten’s four newbuilds run on natural gas (LNG) while Hurtigruten’s seven vessels run on a blend of marine diesel oil and biofuel.
PaM transport No. 13
Requirements for zero and low-emission technology in tenders for public ferries
In 2016 the CO2-emissions from national and regional ferry routes in Norway were approximately 540,000 tonnes, and almost all the ferries used conventional fossil fuels. In 2023 ten out of 108 ferry routes were zero-emission and 30 routes were partly zero-emission, either operated by two or more fully electric and marine or liquid gas, or ferries with hybrid solutions. This development is largely a result of requirements for zero and low-emission technology in tenders for public ferries, both on the ferry routes connecting national highways and on the regional road network. The National Public Road Administration (NPRA), the body responsible for the procurement of ferry services on the national highways, estimates that in 2030, more than two-thirds of domestic car ferry routes will be possible to operate with ferries powered by electricity.
Due to high energy demand or lack of access to electricity, there are a few ferry routes that are not suitable for all electric operation. In their analysis, the NPRA expects that ferries powered by hybrid solutions or exclusively on other energy carriers such as biogas, biodiesel, and hydrogen will operate the remaining part of the domestic ferry routes. In 2019, the NPRA signed a development contract, with the result of an electric hybrid fuel cell battery powered car ferry. The ferry was put into operation on March 31 and is powered by equal amounts of hydrogen and electricity as energy carriers, and the final equipping is due in 2022. The objective of the development contract was to make zero emission technology available for ferry routes that would not be suitable for all-electric operation and has led to yet another signed contract with the requirements of two hybrid fuel cell powered car ferries in operation in 2025. These car ferries will be powered by hydrogen in addition to biodiesel as energy carriers.
PaM transport No. 14
Green shipping programme
The government’s policy on green shipping has been developed through close cooperation between the authorities and the industry. A good example is the cooperation on the Green Shipping Programme (GSP), a public-private partnership that aims to advance the Norwegian government’s strategy and plans. The GSP perform studies, start pilots, transfer knowledge between theory and practice and facilitate dialogue and collaboration between all stakeholders. The GSP involves the whole maritime supply chain; from shipyards, equipment and system suppliers, design companies, finance institutions, shipowners, certification services, research and development societies, public transport buyers and governmental bodies. The program consists of 118 partners, 105 private companies as well as 13 government observers. The GSP is financed partly by public allocations from the state budget and partly by the members themselves. Since the program was started in 2015, 54 green pilot projects have been initiated, of which 19 have been implemented or are under construction.
PaM transport No. 15
Risk loan scheme for low and zero emission vessels, short sea vessels and fishing fleet
The loan scheme was established in 2020 and is similar to the Innovation Norway’s innovation loan scheme (see PaM cross-sectoral No. 8). The aim is to stimulate green fleet renewal and reduced greenhouse emissions. Risk loans can be given to investments in new vessels using low and zero emission technology or for upgrading existing vessels into low or zero emission vessels. The risk loan scheme is state aid under General Block Exemption Regulation (GBER) and supplements other public and private market-based financing and loans.
PaM transport No. 16
High speed passenger ferries scheme
In 2019, the Government introduced a new policy instrument to promote emissions reduction project for high-speed passenger ferries in Norwegian municipalities and counties called «Hurtigbåtprogrammet». The Norwegian Environment Agency is responsible for administering the financial support scheme. The Norwegian Environment Agency assesses and prioritises the application based on given criteria. The objective of the programme is to reduce emissions from the segment and facilitate transition to zero and low emission technology for high speed passenger ferries. Examples of supported projects are feasibility studies for zero emission vessels, development of new technologies such as battery-electric and hydrogen powered vessels, dedicated funding of new tenders that require zero emission technologies and cooperative projects between country councils.
«Hurtigbåtprogrammet» has allocated NOK 270 million to 21 different projects since it was started in 2019. There have been 7 different tenders where municipalities and county councils have competed for funding. There has been substantial interest in the scheme, and it has so far contributed to significant and necessary development of zero emission high-speed ferries.
PaM transport No. 17
Maritime Zero 2050
Maritime Zero 2050 is a research and development (R&D) initiative directed towards development of zero emission solutions for large ships sailing long distances. The Research Council of Norway is responsible for the call and the funding will go to projects that will achieve new knowledge and develop new technologies and solutions, suitable for vessel segments and sailing distances which do not already have available zero emission solutions. The initiative is important for the ambition to reduce emissions from domestic shipping and fishing vessels by half by 2030 and promote the development of zero- and low emission solutions for all vessel categories.
The Norwegian government has in since the commencement of Maritime Zero 2050 in 2022 to 2024 allocated NOK 112.5 million in total to the programme. The Research Council of Norway has distributed this to the Collaborative Project to meet Societal and Industry-related Challenges and the calls for Innovation Project for the Industrial Sector. The solutions should also be scalable for industrial use.
In the project portfolio, there are R&D projects related to zero-emission fuels such as liquid hydrogen and nuclear power for commercial ships. There are also R&D projects that will enable zero-emission solutions for large ships sailing over long distances by significantly reducing energy consumption. Furthermore, there is a R&D project that aims to make it possible to document, track, and verify GHG emissions of marine fuels across the entire fuel supply chain, and a project that will develop a new gas analyzer and a sampling system that measures actual emissions of environmental gases on ships, focusing on being able to measure nitrous oxide and carbon dioxide simultaneously.
PaM transport No. 18
Investments in railways
Developing a competitive railway transport system for passengers and freight is of high priority in Norway. Emphasis is placed on improving the passenger rail network around the big cities and improving capacity for freight transport on longer distances. There have been substantial increases in funding for investment in new railways and maintenance of existing railways the last years. The grant to the railway sector has increased the last years, in 2023 the grant was NOK 32 billion. In the National Transport Plan 2025–2036, it is proposed a shift from large investment projects to more maintenance and renewal of existing infrastructure.
One of the main objectives for increased investments in railways is related to the goal «zero traffic growth for passenger cars» (see above) in the nine largest city-areas in Norway. All of these cities are working towards urban growth agreements with national authorities, which obliges them to reduce growth in passenger car transport.
PaM transport No. 19
Grant funding to transport freight by rail
In order to reduce the negative external effects of transport, such as local and global air pollution, climate gases, noise, congestion and accidents, the Norwegian government aims to encourage freight by rail transport. However, rail freight companies in Norway have scarce opportunities to invest and expand due to strong competition from road transport. To improve conditions for rail freight operators, and to facilitate a shift from road to rail, the Norwegian government issued a temporary support scheme which was approved by ESA and adopted by the Parliament in 2019. The scheme was renewed in 2024.
According to Section 6-5 of the Regulation on Railways Operations, the Ministry of Transport has the possibility to introduce, under certain conditions, a support scheme for Railways. The Ministry have delegated this power to the Norwegian Railway Directorate. The Directorate draws up the detailed provisions in guidelines, in accordance with the notification to ESA, and administer the scheme. The scheme is financed through the annual national budget and was granted 101 million NOK in 2024.
Boks 2.5 Electrification of Railways
Roughly 80 per cent of all trains driven each year in Norway runs by electricity, while the rest is driven by fossil fuels. In 2022, the total amount of greenhouse gas emissions form rail transport was approximately 58,000 tonnes CO2- equivalent. Electrification of the rail network is an important measure to reduce emissions, and smaller parts of the rail network are currently being electrified. The Norwegian Railway Directorate presented a concept study in 2023 with recommendations for zero or low-emission solutions for the rest of the non-electrified lines. This will in practice reduce rail emissions in Norway to near zero and compound the emission reducing impacts of the other projects that are prioritized in the National Transport Plan.
PaM transport No. 20
Zero emission requirements for public procurement of vehicles
Zero emission requirements were set for public procurements of passenger cars from 1. January 2022, for vans from 1. January 2023 and for city busses from 1. January 2024. Exemptions can be made in certain cases where amongst other the primary need for the acquisition cannot be met by vehicles, sufficient charging infrastructure is not available or if city busses use biogas. According to the National transport plan 2025–2036, zero emission requirements will also be considered for public procurements of heavy vehicles.
Boks 2.6 Other advantages for zero emission vehicles (ZEVs)
In addition to the tax benefits, ZEVs have other benefits, such as access to bus lanes (decided locally), reduced toll fares, a discount on car ferry crossings, and reduced parking fees on public parking spots. Norway has more than 20,000 publicly available charging points, and over 5,000 of these are fast charging points. Many publicly available charging points have received funding via the state-owned enterprise Enova. Both these advantages, and the advantages presented in the different PaMs, is continuously under evaluation. We need sufficient ZEV advantages, but not so good that they outcompete public transport. Striking the balance between ZEV advantages and wanting to move transport from cars to public transport is a constant challenge.
2.5.7 Industrial process and product use (IPPU)
This sector covers primarily emissions from the manufacturing industry, including emissions from industrial processes. A number of policies and measures have been implemented over the years. From 2013, emissions of CO2 PFCs and N2O from processes in the manufacturing industries are to a large extent covered by the EU Emissions Trading Scheme (EU ETS). Prior to the EU ETS, a number of agreements concerning the reduction of greenhouse gas emissions have been concluded between the industry and the Norwegian Government. HFCs are regulated through a tax and reimbursement scheme together with F-gas regulation and the Kigali Amendment.
PaM industry No. 1
CO2 compensation scheme
Norway established a CO2 compensation scheme for the manufacturing industry in 2013. As Norway is part of the integrated Nordic electricity market with cables linking our system to the European continent, increased electricity prices in Europe, due to the EU Emissions Trading System (EU ETS), result in increased electricity prices in Norway. The result is a competitive disadvantage for the electricity intensive manufacturing industry in Norway compared to manufacturers in countries outside of Europe without the same stringent climate policies. The purpose of the CO2 compensation scheme is to prevent carbon leakage from Europe as it intends to partly counteract this disadvantage.
The compensation scheme is based on the EFTA Surveillance Authority’s (ESA) Guidelines on certain State aid measures in the context of the system for greenhouse gas emission allowance trading post-2021. The scheme includes all sectors listed in the ESA Guidelines, among others aluminium, ferro alloys, chemicals and pulp and paper.
The Norwegian government has proposed amendments in the scheme, including a new requirement in relation to 40 per cent of the aid: the beneficiaries shall use at least 40 per cent of aid received, in the period 2024-2030, on climate mitigation measures or energy efficiency measures in Norway. This requirement will support the manufacturing industry’s measures in reducing emissions and increasing their energy efficiency, and thus supports and strengthens the objective to reduce the risk of carbon leakage, as well as contributing to a green transition.
PaM industry No. 2
Use of bio carbon in the production of cement and ferroalloys
In the production of cement and ferroalloys, the sectors have voluntarily replaced some of the coal consumption with bio carbon. In the production of ferroalloys, the share of bio carbon of the total amount of reducing agents increased from 2 per cent in 2000 to 21 per cent in 2022.
PaM industry No. 3
N2O reduction, production of nitric acid
In 2022, the N2O emissions from the production of nitric acid equalled about 52 ktonnes CO2 equivalents. The N2O emissions from the production of nitric acid decreased by 97 per cent from 1990 to 2022. This is partly explained by the fact that one of the production lines was restructured in 1991, but mainly because more and more of the production from 2006 and onwards has been equipped with a new technology – N2O decomposition by extension of the reactor chamber. As a result of the new technology, the implied emission factor (IEF) for nitric acid production decreased from 5.0 kg N2O per tonne nitric acid in 1990 to 0.1 kg N2O tonne of nitric acid in 2022.
PaM industry No. 4
Agreement with the aluminium industry
In 1997, the major aluminium producers signed an agreement with the Ministry of Climate and Environment to reduce emissions of greenhouse gases (CO2 and PFCs) per tonne of aluminium produced by 50 per cent in 2000 and 55 per cent in 2005, compared with 1990 levels. The agreement was followed by a new agreement with the industry for the years 2005–2007. In 2005 the CO2 equivalent emissions of PFCs per tonne of aluminium produced were 85 per cent lower than in 1990 and 84 per cent lower in 2007. The emissions was from 2013 covered by the EU emission trading scheme. The emission intensity has continued to decrease and the PFC emissions were about 97 per cent lower in 2022 than in 1990.
PaM industry No. 5
F-gas regulations and the Kigali Amendment to the Montreal Protocol
Norway has implemented the EU Regulations on certain fluorinated greenhouse gases (No. 842/2006 in 2010, revised by No. 517/2014) in 2018. The regulation sets up measures to prevent emissions of F-gases from existing equipment by requiring leakage checks, proper servicing and recovery of the gases at the end of the equipment’s life. It also bans the use of F-gases in many new types of equipment and products where less harmful alternatives are widely available. On 7 February 2024, EU adopted a revised F-gas regulation, introducing additional prohibitions on the use of F-gases in a wider range of equipment and products, as well as expanding measures to prevent emissions. Norway is currently working on implementing this revised F-gas regulation in our national legislation.
Norway is exempted from the EU HFC phase-down scheme of the EU f-gas regulation. This is mainly justified by the implementation of the Kigali Amendment to the Montreal Protocol. Norway has ratified the Kigali Amendment, and the phase-down scheme for HFCs entered into force in national legislation by 1 January 2019. In the national legislation, Norway has implemented a stricter phase-down scheme than its obligations under the Montreal Protocol.
Norway has implemented the EU Directive 2006/40/EC which gradually bans the use of HFCs with high GWP in air-condition systems in passenger cars and light commercial vehicles.
PaM industry No. 6
Tax and reimbursement scheme on HFC and PFC
To curb the expected growth in HFC emissions due to the phase-out of ozone-depleting substances, a tax on import and production of HFCs was introduced in 2003 (the tax also includes PFCs, but the use of these gases is insignificant). In 2004, this tax was supplemented with a refund scheme, which prescribes a similar refund when gas is destroyed. The tax was initially NOK 180 per GWP-tonnes. In 2024 the tax is NOK 1,176 per tonne CO2-equivalents, after relatively large increases since 2014. Emissions of HFC/PFC are taxed at the same level as the standard tax rates for CO2, measured in NOK per ton CO2-equivalents. Since the tax is levied on imports of the gases, and not on actual emissions of HFC, the tax is combined with a refund scheme to target emissions of HFC.
The tax and reimbursement schemes have resulted in better maintenance and improved routines for discarding old equipment. It also provides a strong incentive for choosing HFCs with the lowest GWP possible and has resulted in the increased use of natural refrigerants, such as CO2, ammonia or hydrocarbons and in recent years the use of HFC with very low GWP (HFOs), in new installations. The tax has had very significant effects on new, bigger installations, where low-GWP alternatives are often available, and the tax might represent a significant share of the investment costs. On smaller mass-produced units, such as domestic heat pumps, the international development as regards legislation (such as the EU F-gas regulation and the Montreal Protocol) and commercialization of new technology is likely the main driving force influencing emissions and choice of refrigerant.
PaM industry No. 7
Tax on SF6
The tax on SF6 was introduced in 2023. The tax covers the import and production of SF6, as well as SF6 included in products. The purpose of the tax is to price emissions of SF6 into the atmosphere. SF6 is primarily used as an insulating medium in electrical installations, etc., either during the first filling or refilling. Emissions of SF6 are small and primarily due to unavoidable leaks or accidents. SF6 is also used in the production of electrical switches. Emissions of SF6 are taxed at the same level as the standard tax rates for CO2, i.e. NOK 1,176 per tonne CO2 equivalent.
2.5.8 Agriculture
Norwegian agriculture is covered by overall Norwegian climate targets and policies as specified in our NDC and our agreements with the EU. The 2024 agricultural agreement (Prop. 105 S (2023–2024)), as adopted per the subsequent recommendation to the parliament June 2024 (Innst. 448 S (2023–2024)), reaffirm that Climate targets are an integral part of agricultural policies. These policies also build on the 2021 White Paper on climate policies (Meld. St. 13 (2020–2021)). The Norwegian Parliament stated that the most important role for agriculture in the context of climate change is to reduce emissions per unit produced, increase the uptake of CO2 and adapt the production to a changing climate.
Current policies and practices to control GHG emissions in Norwegian agriculture include a combination of regulatory, economic and informatorily measures. CO2 from the use of fossil fuels in activities related to agriculture meets CO2 taxation similar to other sectors. A mandatory biofuels turnover for non-road machinery, including agricultural machinery, was introduced in 2023. The general ban on fossil fuels for heating buildings is imposed for agriculture from 2025. Emissions related to transport and energy are accounted for in other sectors. Direct emissions from agriculture are covered neither by the emissions trading system, nor subject to GHG taxation, rather they are covered by other measures as specified below.
Previous reporting of the emission inventory and reports to the UNFCCC have identified key emission sources from Norwegian agriculture. These include methane from livestock and manure, nitrous oxide from manure and fertilized soils, and losses of carbon- and nitrogen-compounds from soils, particularly organic soils. While abatement of such emissions is considered important, it is difficult to decouple the volumes of emissions from the volumes of production.
Emissions from livestock have been slightly reduced over the last decades. This results from successes with animal breeding, welfare and feeding which have enabled increases in output per animal.
Key measures to reduce N2O include improving manure management and fertilizer use so that less N-input is needed per unit of product. Such improvements can have various co-benefits, including reduction of run-off to water as well as ammonia emissions. The sector is making efforts to improve the use of fertilizers through improved storage, spreading, timing and dosage of fertilizer – according to crops’ needs. Precision agriculture is under development with increasing use of GPS technology in land management. A combination of regulatory and economic instruments support such improved practices and emission reductions. This year a proposal for a revised fertilizer regulation was up for consultation. The proposal contains several measures that will reduce and optimize fertilizer application. The ministries are reviewing the consultation with the aim for a new regulation to come into force early 2025. Restrictions on cultivation of peatland took force in 2020 to mitigate emissions of N2O and CO2, as reported under the agricultural sector and the LULUCF sector respectively. Recent reports show a steep decline in such cultivation since these restrictions entered into force.
Emission figures for agriculture have high uncertainty as emissions also depends on precipitation patterns, temperature or soil properties. Various emission sources have been identified as «key category sources» that have priority for further methodology development. Collaboration between agriculture and climate experts has improved the technical understanding and enables development of measures and instruments to further reduce emissions.
PaM agriculture No. 1
Regional agri-environmental programme
The regional agri-environmental programmes are support schemes directed at environmental challenges in different parts of the country. Each county (region) uses schemes/measures taken from a national «menu», according to the priorities of the regional environmental programme. These involve area-based payments for farming practices to achieve various agri-environmental targets, such as reducing run-off and emissions.
In the 2023 and 2024 agricultural agreements, funds for Regional Agri-environmental Programmes have been upscaled. The lion’s share of the additional funds was earmarked to reduce erosion and run-off, while the upscale will also benefit climate goals. Other priority areas include support to environmentally friendly spreading of manure, which is primarily directed to abate ammonia loss, but will also have co-benefits for GHG-emissions. From 2023, measures to advance soil health and soil carbon sequestration have also been eligible for support over regional agri-environmental programmes.
PaM agriculture No. 2
Requirements and support for livestock on pasture
Keeping livestock on pasture may help abate emissions from manure management compared to keeping animal in confinement. Naturally, most livestock in Norway must be kept indoors for part of the year, while there are requirements that cattle, sheep and goats should be free-range for minimum periods in summer, and additional support is paid for those who are kept outdoors longer. Through such practices, emissions from storage and spreading of manure are avoided and replaced by lower emissions from dung and urine deposited on pasture.
PaM agriculture No. 3
Support scheme for Special Environmental Measures in Agriculture
The support scheme for Special Environmental Measures in Agriculture support investments towards environmentally friendly practices. From 2017 this scheme has been expanded to support better storage of manure, to control emissions of CH4 and N2O.
PaM agriculture No. 4
Drainage of agricultural soils
The main purpose of the scheme is to increase the quality of cultivated land by financial support for drainage of poorly drained soil, in order to increase productivity and reduce risk for erosion and water pollution. As a side-effect, better drainage may also reduce GHG emissions on mineral soils.
PaM agriculture No. 5
Project Climate Smart Agriculture
A project called Climate Smart Agriculture was established in 2017. The aim of the project is threefold; making a system for data collection and documentation of practical measures, develop a system for on-farm climate decision support, and information and sharing of knowledge. Under the project, training has been provided for extension services in support of climate-smart agriculture, and a «climate calculator» has been developed for on-farm assessment and decision-making support in these areas. Per 2024, about 9,000 out of a total 38,000 farm units in Norway have taken the calculator into use.
PaM agriculture No. 6
Climate and environment programme
The aim of the Climate and environment programme is to contribute to climate and environmental goals within the agricultural policy through research and information measures. The programme is directed towards practical and agronomical knowledge on climate and environmental challenges, that can be quickly disseminated to on-farm implementation. Examples of projects that have been supported by this programme are Climate smart agriculture, Carbon farming and Effects of tillage on run-off of nitrogen and phosphorus.
PaM agriculture No. 7
Delivery of manure for production of biogas
There is a support scheme for delivery of manure to biogas production plants, to compensate for additional costs arising from such delivery and increase the uptake of such treatment.
PaM agriculture No. 8
Restrictions on cultivation of peatlands
Land conversion from peatland to cropland has been extensive historically, and approximately 60,000 ha of croplands (7 per cent of the total cropland area) in Norway are identified as drained organic soils. These soils are a significant source of N2O and CO2, as reported under the agricultural sector and LULUCF, respectively. As described under chapter 2.5.9 (PaM LULUCF No. 6) restrictions for the cultivation of peatland took force in 2021. Cultivation of peatland has been reduced from 82 ha in 2021 to 17 ha in 2023. Such restrictions affect the emissions of N2O alongside the effects for CO2.
2.5.9 Land Use, Land-Use Change and Forestry (LULUCF)
Forests absorb CO2 and store large quantities of carbon. They are also an important source of renewable energy and wooden materials that can be used to replace materials with a larger carbon footprint. Forest biomass is also important as feedstock to bio-energy carbon capture and storage (BECCS) plants and other CDR technologies. Other terrestrial ecosystems and organic soils are also large carbon sinks. Human activity can cause large greenhouse gas emissions through land use and conversion of areas and ecosystems to other forms of use. To achieve a balance between anthropogenic greenhouse gas emissions and removals by sinks in the second half of this century, which is one of the aims of the Paris Agreement, it will be vital to reduce emissions and increase removals in the LULUCF sector. Boreal forests grow slowly, hence the mitigation effects must be considered in a very long timescale.
In addition to the PaMs described in this chapter, the Planning and Building Act (PaM cross-sectoral No. 5) constitutes the legal framework for decisions on land use and land use change.
PaM LULUCF No. 1
Higher seedling densities in existing areas of forest land
Using higher seedling densities for forest regeneration increases the growing stock and CO2 removals by forest. In 2016, a grant scheme was launched to increase the seedling density used for regeneration after harvesting. This measure forms part of ordinary planting after harvesting, and thus does not involve any afforestation.
PaM LULUCF No. 2
Genetical improvement, plant breeding
In 2016, a grant scheme was launched to support plant breeding. Tree breeding involves using of the genetic variation in forest trees to produce seeds that are more robust and provide higher yields than non-improved seed from ordinary forest stands. High-quality seeds have been produced in seed orchards, making it possible to develop forests where the tree survival rate is high, timber quality is better and volume growth is 10–15 per cent larger. If more effective tree breeding techniques are used, it may be possible to increase the growth in volume by 20 per cent or more. Thus, tree breeding is a way of increasing CO2 removals by forests. In addition, it is possible to ensure that forest reproductive material is resilient to future climate change.
PaM LULUCF No. 3
Fertilization of forests as a climate mitigation measure
On forest land where growth is inhibited by the availability of nitrogen, using nitrogen fertiliser will increase both diameter and height growth, and increase annual CO2 removals for the next ten years. A grant scheme for fertilisation of forest as a climate mitigation measure was started in 2016. It is designed to meet recommended environmental criteria and avoid unacceptable effects on biodiversity and the environment otherwise.
PaM LULUCF No. 4
Tending of juvenile stands
Tending of young stands is necessary to select the most adapted tree-species and optimize growth. Correct spacing between the most adapted tree species lead to improved tree stability with straight stems that provide high quality lumber. The need for tending is stipulated to 40,000 ha per year, but the area treated (2022–2023) has been around 26,000 ha per year.
PaM LULUCF No. 5
Regeneration with proper tree-species
The Norwegian Forestry Act requires preparation for regeneration to a certain number of trees pr area unit within 3 years after harvesting. A new regulation defines that only tree species with satisfying production of lumber in terms of quality and utilization of the growing potential (potential for removals) can be accounted for.
PaM LULUCF No. 6
Reduced emissions from peatlands and bogs
Peatland bogs and mires are important carbon stocks. There are restrictions against the cultivation of peatland and mires in Norway. The restrictions came into force in 2020. Farmers may apply for exceptions from these restrictions provided that certain conditions are met.
2.5.10 Waste
The main goal of the Norwegian waste policy is that waste is to cause the least possible harm to humans and the environment. The quantity of waste generated is to be considerably lower than the rate of economic growth, whilst rates for the preparing for reuse and recycling should rise. Furthermore, the amount of hazardous waste is to be reduced and hazardous waste is to be dealt with in an appropriate way. The measures to reduce greenhouse gas emissions are to a large extent concurrent with measures to increase recycling and recovery. The most important measures are:
Regulations under the Pollution Control Act, including the ban on depositing biodegradable waste in landfills and requirements regarding extraction of landfill gas (see below).
Extended producer responsibility for specific waste fractions.
The tax on waste incineration (described under 4.3.2)
In general, targets set in EU waste directives, such as EU-targets for preparing for reuse and recycling of municipal waste, also apply for Norway owing to the EEA agreement.
PaM waste No. 1
Requirement to collect landfill gas
The largest emissions in the waste sector derive from landfill gas. In 2022, the methane emissions from landfills amounted to approximately 31,300 tonnes, corresponding to 2 per cent of the total greenhouse gas emissions in Norway. Landfill gas emissions have been reduced by about 52 per cent from 2000 to 2022 and by more than 60 per cent from 1990 to 2022. The reduction is mainly due to the decrease of organic waste in landfills as depositing biological waste has been prohibited.
The Landfill Directive was incorporated into national law by the Norwegian Landfill Regulations of 21 March 2002, and states that all landfills with biodegradable waste must have a system for extracting landfill gas. The gas emissions are monitored by measuring boxes placed on the landfill surface. Also, visual inspection of the landfill surface for obvious leaks should be conducted regularly.
Extraction of landfill gas increased from about 950 tonnes CH4 in 1990 to about 19,400 tonnes CH4 in 2010. In 2022, extracted methane from landfills amounted to 3,820 tonnes CH4. The reduction is primarily due to the prohibition of depositing organic waste. In Norway, in 2022, 18 per cent of the landfill gas production was utilized to generate electricity. 54 per cent is flared, and 27 per cent is used in heat production.
PaM waste No. 2
Ban on depositing biodegradable waste in landfills
In 2002, Norwegian authorities introduced a ban on depositing easily degradable organic waste in landfills. This prohibition was replaced in 2009 by a ban on the depositing of all biodegradable waste in landfills. Since the introduction of these regulatory measures, the annual amount of biodegradable waste deposited in landfills has been reduced by more than 90 per cent in the period between 1990 and 2022. Meanwhile, the amount of all waste generated increased by more than 69 per cent in the same timeframe. Due to the decomposing process, CH4 production from landfills will continue for several decades after the waste has been disposed of. Nevertheless, the prohibition on depositing biodegradable waste in landfills will reduce CH4 emissions over time, as the amount of deposited biodegradable waste is reduced.
PaM waste No. 3
Tax on waste incineration
Norway introduced a tax on the final disposal of waste (including both landfills and incineration) on 1 January 1999. The tax for incineration was lifted on 1 October 2010 and for landfills in 2015. The purpose of the tax was to place a price on the environmental costs of emissions from landfills, and thereby provide an incentive to reduce emissions, increase recycling and reduce the quantities of waste. The tax had a specific CO2-component aimed at reducing emissions of CO2 from waste incineration. In 2022, a tax on emissions of CO2 from waste incineration has been reintroduced. In 2024, the rate for non-ETS emissions is NOK 882 per tonne of CO2 equivalent, which corresponds to 75 per cent of the general level for ESR emissions. ETS emissions from waste incineration are subject to a reduced rate, which corresponds to 15 per cent of the general level for Emission Sharing Regulation (ESR) emissions.
PaM waste No. 4
Other measures in the waste sector
Extended producer responsibility (EPR)
The systems of extended producer responsibility (EPR) are based on requirements regarding waste regulation and to some degree on tax incentives. EPR means that the cost of waste management is included in the price of the product in accordance with the principle that the polluter pays. The scheme gives the producer incentives to reduce this cost by making products that are more durable and easy to reuse and recycle.
EPR is important to ensure that waste is collected and sent to approved treatment and for fulfil national or EEA-wide targets for recycling. Extended producer responsibility schemes have been made for packaging, electric and electronic products, tires, batteries, vehicles and PCB-infected insulation of windows.
Agreement on reduction of food waste
In 2017 the government concluded an agreement on the reduction of edible food waste together with relevant stakeholders representing the entire food value chain. The parties to the agreement have committed to reduce edible food waste by 50 per cent by 2030. The initial results indicate that the levels of edible food waste in Norway were reduced by nearly 10 per cent in the period between 2015 and 2020. This was five percent less than the interim goal of 15 per cent food waste reduction by 2020. In order to reach their food waste reduction goal, the parties to the agreement must therefore accelerate their efforts in the years to come.
Measures to increase waste recycling
The waste regulations regulate a number of waste fractions, and for some fractions set specific targets for recycling, for instance for end-of-life vehicles.
When it comes to EU-targets for preparing for reuse and recycling of municipal waste, a revision made this year of the national waste regulation introduces a new requirement, applicable as of 2025, to sort and separately collect paper and cardboard, glass and metal packaging and textile waste. It is already a requirement to sort and separately collect biowaste (i.e. food, park and garden waste) and plastic waste at source. Furthermore, the regulation requires that all the fractionsseparated at source are sent to recycling.
There is also a tax on beverage packaging. The tax is reduced by the accepted recycling rate; each percentage of recycling reducing the tax one per cent. The recycling rate is set by the Environment Agency and regulated by the waste regulation.
The pollution control act encourages municipalities to determine differentiated waste fees, as this could contribute to waste reduction and increased recycling. Many municipalities in Norway collect source separated household waste like paper and cardboard waste or biological waste free of charge or to highly reduced fees. The costs are subsidized by the fees for the mixed waste. This gives incentives to the inhabitants of a municipality to separately collect certain fractions of household waste that can be recycled. It has been proposed to change the pollution control act to make it mandatory for municipalities to determine differentiated waste fees.
2.5.11 Planned measures
In this first BTR, planned measures have also been included. The additional PaMs that have an estimated mitigation effect are included in the projections with additional measures (WAM). This includes measures proposed by the government in the Climate status and plan, which have not yet been adopted by the parliament. The effects these PaMs have on the various sectors are reported in CTF table 5 and summarized in Table 2.13 in chapter 2.7.6.
PaM WAM No. 1
Changes in environmental taxes on fuels and GHGs
In 2021, the government announced that the CO2 tax on emissions under the Effort Sharing Regulation (ESR) will be increased to NOK 2,400 by 2030 (in real 2025 NOK).
The government have proposed to increase the tax on waste incineration towards the same level as the CO2 tax on emissions under the ESR from 2026. The tax on HFC, PFC SF6 is planned to follow increases on the CO2 tax. These are a planned measures which has not yet been adopted by the parliament.
PaM WAM No. 2
Further measures to reduce emissions from building and construction
Requirements in public procurement for emission-free energy use at construction sites
The government is conducting an official study on requirements in public procurement for emission-free energy use at construction sites. The requirement under consideration is that 5–10 per cent of energy consumption must be emission-free by 2026, with an increase to 30–40 per cent by 2030.
Ban on the sale of new construction machinery with combustion engines from 2035
The government announced in 2024 that it will launch an official study on banning the sale of new construction machinery with combustion engines from 2035. Exemptions will be considered.
New ban on the use of fossil gas for heating buildings under construction
A proposal to ban the use of fossil gas for temporary heating and drying of buildings under construction is under consideration. The government plans to implement the ban from 2025.
PaM WAM No. 3
New ban on the use of fossil gas for heating buildings
Ban on the use of fossil gas for heating buildings from 2028
The government is conducting an official study on the expansion of the current ban on the use of mineral oil for heating to also include fossil gas. The study will assess the consequences for safety and self-sufficiency. This is a step towards phasing out all use of fossil fuels for heating buildings. The government aims to extend the oil heating ban to also include fossil gas from 2028.
PaM WAM No. 4
Increased biofuel mandate
The government plans to increase the biofuel mandates. In the «Government’s Climate Status and Plan», released in October 2024, a plan for annual increases in biofuel mandates is presented. The following is proposed:
Gradually increase the biofuel mandates for road traffic to 33 per cent by 2030
Gradually increase the biofuel mandates for biofuels for other purposes (non-road machinery) to 28 per cent by 2030
Gradually increase the biofuel mandates for shipping to 18 per cent by 2030
Aim to increase the biofuel mandates in aviation at the same level as the EU regulation RefuelEU Aviation. However, it is essential to ensure airlines are credited for the use of biofuels in the EU ETS before the mandate is increased. Therefore, from January 1, 2025, the mandate will be kept at the same level.
PaM WAM No. 5
Further measures to reduce emissions from shipping
The Norwegian government has adopted general zero emission requirements for ferries and ferry services. The requirements will be in force for all new contracts in public tenders from January 1st 2025. There are exceptions from the requirement in case of biogas, planned road connections, lack of infrastructure and lack of technological and economic feasibility.
In the 2025 National Budget, the government proposes to increase funding of the high speed passenger ferries scheme («Hurtigbåtprogrammet») with 200 million NOK (see PaM transport No. 16).
The Norwegian government is planning for low and zero emission requirements for vessels in aquaculture within 2025.
The Norwegian government is planning for low emission requirements for vessels in the offshore industry within 2025 and zero emission requirements within 2029.
PaM WAM No. 6
Further measures to reduce emissions from road traffic
In the Government’s 2025 Climate Status and Plan (an attachment to the National Budget), the government proposes measures to reduce emissions from road traffic, to meet zero emission targets from the National Transport Plan, including a long-term target that new heavy vehicles should be emission free or use biogas by 2030. The measures include:
Increased funding for the state agency Enova by NOK 1.7 billion, including 1.2 billion in support of heavy duty transport, both for zero emission vehicles and charging infrastructure. See also PaM cross No. 6.
Accelerated effort to improve existing and establish new rest and overnight rest areas in order to arrange for charging. The Government has prioritized money to this work in their proposed state budget for 2025.
Not open up for toll payment for heavy zero-emission vehicles for a period up to 2030.
PaM WAM No. 7
Further measures to reduce emissions from the industry sector
In 2024, the Norwegian government announced the introduction of a ban in 2030 on the use of fossil fuels for stationary indirect heating for energy purposes that results in emissions under the effort sharing regulation. A draft regulation for the ban has been sent for consultation.
PaM WAM No. 8
Further measures to reduce emissions from agriculture
Revised fertilizer regulation
This year a proposal for a revised fertilizer regulation was up for consultation. The proposal contains several measures that will reduce and optimize fertilizer application. The ministries are reviewing the consultation with the aim for a new regulation to come into force early 2025.
MetanHUB
A project called MetanHUB has been established with the aim to clarify whether, under Norwegian conditions, methane production from ruminants can be reduced by using feed additives. The project has been granted support through the agricultural agreement.
Support through the agricultural agreement
Through the agricultural agreement of 2023-2024, the government is providing financial support for fertilizer measures, water environment measures, energy efficiency and biogas, among other things.
PaM WAM No. 9
New food waste legislation
The government aims to propose new food waste legislation in the spring of 2025, with regulations coming into force during 2026. Additionally, the government will initiate a revision of the industry agreement on reducing food waste, based on proposals from the Food Waste Committee.
PaM WAM No. 10
Increased CO2-tax on emissions under the ETS on the continental shelf
In the budget for 2025 the government proposed to increase the CO2-tax on the continental shelf so that the total emissions priced, meaning the sum of the tax and the price of allowances under the EU ETS, will reach NOK 2,400 in 2030. In 2024 the tax rate was NOK 790 per tonne CO2, while the ETS price is estimated to NOK 750, resulting in a total emission price of NOK 1,540 per tonne CO2.
2.5.12 PaMs no longer in place
There are some PaMs that were reported in the NC8/BR5 that are not reported in this first BTR. The list of such PaMs are shown below.
The PaM «Aid scheme for short sea shipping» did not produce the desired results and has therefore been abolished.
The PaM «Base tax on mineral oils etc.» was abolished from 1 January 2023, due to increased energy prices.
The PaM «Taxes and regulations on emissions from road transportation» was a group-PaM that covered several other PaMs related to road transport». It was decided not to report a group-PaM.
The PaM «Arrangement to reduce emissions in the processing industry (2004)» had a target for the year 2007 and has been abolished.
The PaM «Arrangement to reduce emissions in the processing industry (2009)» had a target for the years 2008-2023 and has been abolished.
The PaM «Green shipping» was a group-PaM that covered several other PaMs related to shipping». It was decided not to report a group-PaM.
The PaM «Recycling scheme for short sea vessels and offshore vessels» did not produce the desired results has therefore been abolished.
The PaM «Agreement on SF6 reduction from use and production of GIS» ended in 2010 and has been abolished.
The PaM «Afforestation» was a pilot project, and has not been implemented yet.
The PaM «Measures to reduce damage from root-rot» has been planned but not been implemented yet.
The PaM «Threshold for tree-stand age by harvesting» has been implemented by the PEFC (Program for the Endorsement of Forest Certification) and need for further regulation will be considered based on more knowledge about rationale reasons for tree-stands to be harvested for they reach maturity.
2.5.13 PaMs that influence GHG emissions from international transport
Norway has for a number of years worked actively through the International Maritime Organisation (IMO) to pursue limitation of greenhouse gas emissions from international shipping. The revised IMO GHG Strategy was adopted at MEPC 80 in July 2023, and sets out an ambition to decarbonise shipping by 2050, including ambitious check-points for 2030 and 2040, as well as an ambition of uptake of 5–10 per cent of zero- or near zero fuels in shipping by 2030. Norway is working actively in the IMO to develop economic and technical measures as amendments to MARPOL Annex VI to reach the levels of ambitions set in the strategy. The aim is to adopt the new regulations in 2025, with entry into force in 2027.
The IMO adopted energy efficiency requirements which entered into force on 1 January 2013. This framework has been expanded further in 2014, and further tightening and expansion of the energy efficiency requirements is adopted with entry into force in April 2022 (EEDI strengthening) and November 2022 (EEXI and CII). The short-term measures are under revision, intended to be completed by 2025. Further, proposals for mid- and long-term measures for reduction of GHG emissions from shipping are under consideration. The IMO data collection system which will collect fuel consumption data entered into force on 1 March 2018. Further the IMO is also addressing short-lived climate forcers through the ongoing work on Black Carbon emissions from shipping. The existing regulation on emissions on volatile organic compounds also addresses these emissions.
In 2020 the IMO updated the estimate of the global greenhouse gas emissions from international shipping. A comprehensive update of emission estimates will be undertaken as a part of a fifth IMO GHG Study which the MEPC has agreed in principle to initiate, and which is planned to be finalized prior to the 2028 revision of the IMO GHG Strategy.
At the national level, Norway implements all relevant provisions of the IMO to limit or reduce emissions. Development of more energy-efficient technologies for shipping is also enhanced through research and development programmes under the Research Council of Norway, Innovation Norway and Enova. Pilot projects on low- and zero-emission shipping are being developed through the Green Shipping Programme which is a private-public partnership.
In the 2025 budget, it is proposed to introduce a reduced tax rate in the CO2 tax on mineral products for emissions from international shipping. In 2025 this tax will amount to NOK 1.33 per litre mineral oil (equivalent to NOK 500 pr ton CO2). It must be clarified that the introduction of a tax does not contravene the state aid regulations before the tax can be introduced.
The 41st ICAO Assembly in 2022 adopted a goal of net zero CO2-emissions in international aviation. The goal shall be reached through technology development, operational improvements, and the use of sustainable aviation fuels. The 41st Assembly reiterated the two global aspirational goals for the international aviation sector of 2 per cent annual fuel efficiency improvement through 2050 and carbon neutral growth from 2020 onwards, as established at the 37th Assembly in 2010. Norway supported the agreement on the global market-based measure (CORSIA) at the 39th Assembly in 2016 and has since 2021 taken part of its voluntary phase. Norway has as an observer seat in the ICAO Committee on Aviation Environmental Protection (CAEP).
The largest emission challenge in air traffic is related to large aircraft and long-distance flights, and Norway therefore welcomes international regulations on international aviation. Norway’s comprehensive aviation strategy from 2023 states that Norway shall strive to achieve a higher level of ambition in European and international processes regarding aviation and climate. As a member of the European Civil Aviation Conference (ECAC), Norway participates actively together with 43 other Member States of that organization with a view to limit greenhouse gas emissions from international aviation through ambitious action in ICAO. Norway also takes part in the «International Aviation Climate Ambition Coalition», which was formed in 2021 to push for a higher level of climate ambition in ICAO.
Norway has, since 2001, imposed a CO2 tax on civil domestic aviation, as one of few countries in the world, as mentioned in chapter 2.5.2 (PaM Cross No. 7). International travel is however exempt from CO2 tax. Norway also participates in the EU Emission Trading Scheme (EU ETS) which cover emissions from flights within EU. The ETS is further explained in chapter 2.5.2.
In 2016, the Norwegian government introduced an air passenger duty. The air passenger duty is a fiscal tax with a potential environmental impact. The tax applies to commercial transport by air of passengers from Norwegian airports, except for flights from the Norwegian continental shelf and airports on Svalbard, Jan Mayen and Norwegian dependencies. There are two rates, depending on the final destination: a low rate for journeys with a final destination in Europe (in 2024 this duty is NOK 85) and a high rate for journeys to other final destinations (in 2024 this duty is NOK 332).
In April 2024 the state owned airport operator Avinor and CAA Norway entered into a cooperation agreement on establishing Norway as an international testing arena for zero- and low- emission aircraft. The purpose of the agreement is to facilitate accelerated phase-in of zero and low emission aircraft by reducing barriers to testing and demonstration. Avinor provides infrastructure, airspace, and access to energy. While CAA Norway offers regulatory facilitation. This initiative stems form the Governments ambition reteriated in Norway’s comprehensive aviation strategy from 2023, and further elaborated in the National Transportation Plan 2025–2036, that the overall climate goal for domestic avaiton is to accelerate the transition to zero- and low-emission aviation so that the first commercial zero-emission aircraft are phased in in Norway as soon as technology permits. The Government prioritized NOK 1 billion over a twelve-year period for this purpose, and has in the state budget for 2025 (Prop 1S (2024–2025)) allocated NOK 50 million for the establishment of the test-arena, split between Avinor and CAA Norway.
2.5.14 Black carbon
When developing its climate policy, Norway also addresses drivers of climate change other than reduction of the greenhouse gases. Measures towards certain sources of CO2 emissions may also have an effect on black carbon (BC) emissions and other short-lived climate forcers. Reducing black carbon can contribute to the slowing down of global warming and in addition have positive health effects. The Intergovernmental Panel on Climate Change (IPCC) adjusted the effect of BC on the global average temperature downward in the latest assessment report. There are however large regional differences. The climate effect is particularly strong in the Arctic where BC contributes to increase the rate of melting of ice and snow when it settles on and darkens these surfaces. The Arctic Council Member States have set a collective, aspirational goal to reduce BC emissions by 25–33 per cent relative to 2013 levels by 2025. The Member States are currently working to update this target.
2.5.15 How PaMs are modifying longer-term trends in GHG emissions and removals
Norway has over the years introduced several policies and measures that have reduced the GHG emissions. There are considerable methodological difficulties in calculating the effect of policies and measures ex post, including establishing a hypothetical baseline and obtaining relevant data. There is also uncertainty related to such estimates. Nevertheless, effects are estimated for a number of policies and measures. According to the estimates, the historical GHG emissions would have been substantially higher than observed, if these policies and measures had not been implemented. The projected emissions would also be higher without the implementation of these policies and measures.
2.5.16 Assessment of economic and social impacts of response measures
Norway strives to follow a comprehensive approach to climate change mitigation from policy development started around 1990, addressing all sources as well as sinks, in order to minimise adverse effects of climate policies and measures on the economy.
In developing environmental, as well as the economic and energy policy, Norway endeavours to include the polluter pays principle and to have a market-based approach where prices reflect costs, including externalities. As regards emissions of greenhouse gases, costs of externalities are reflected by climate taxes and by participation in the European Emissions Trading Scheme (EU ETS). These instruments place a price on emissions of greenhouse gases. The Norwegian Government contends that the best way to reduce emissions on a global scale, in line with the aims limiting the global average temperature increase to 1.5 °C above pre-industrial levels, would be to establish a global price on emissions. Pursuing a global price on emissions would be an efficient way to ensure cost-effectiveness of mitigation actions between different countries and regions, and secure equal treatment of all emitters and all countries. This will help minimise adverse impacts of mitigation. For more information about climate taxes and the design of the EU ETS, see chapter 2.5.2.
Norway is involved in several international and regional initiatives that contribute to technology development and transfer and enhanced capacity building to developing countries with the aim of contributing to maximize the positive and minimize the negative effects of response measures, including economic diversification and a just transition. One important aspect is to facilitate the shifting of the energy mix away from high emission sources to more renewable energy systems and low-emission sources and diversifying economies. These initiatives are reported here as relevant activities under Article 3.14 of the Kyoto Protocol.
The former government presented a national strategy for green competitiveness in October 2017. The aim of the strategy is to provide more predictable framework conditions for a green transition in Norway, while maintaining economic growth and creating new jobs. An expert commission presented its report with an analysis of Norway’s exposure to climate risk in December 2018. The report has a clear recommendation to pursue ambitious and effective climate policies and undertake climate risk analysis to become more robust to effects of climate change.
Carbon capture and storage (CCS) is one of five priority areas for enhanced national climate action. Norway strives to disseminate information and lessons learned from projects in operation in the petroleum sector, new large-scale projects under planning and from research, development and demonstration projects. The information and lessons learned are shared both through international fora, and through bilateral cooperation with developing and developed countries. For further information, see chapter 15.2 of Norway’s National Inventory Report for 2022.
The Norwegian Oil for Development (OfD) programme, which was launched in 2005, aims at assisting developing countries, at their request, in their efforts to manage petroleum resources in a way that generates economic growth and promotes the welfare of the whole population in an environmentally sound way. A description of the OfD program can be found at: https://www.norad.no/en/front/thematic-areas/oil-for-development/. The programme is currently engaged in 8 countries, mainly in Africa.
The operative goal of the program is «economically, environmentally and socially responsible management of petroleum resources which safeguards the needs of future generations.» OfD takes a holistic approach meaning that management of petroleum resources, revenues, environment and safety are addressed in a coherent manner. OfD assistance is tailor-made to the particular needs of each partner country. It may cover the designing and implementing legal frameworks, mapping of resources, environmental impact assessments, handling of licenses, establishing preparedness to handle accidents and oil spills, health, safety and environmental legislation, petroleum fiscal regimes and petroleum sovereign wealth fund issues as well as initiatives related to transparency, anti-corruption, and climate change.
In 2021 the prior government decided to gradually phase out the OfD and discontinue the programme by 2024. This change was conducted to steer the development assistance in a greener direction with focus on climate change and renewable energy. In accordance with the Norwegian development policy with focus on renewable energy, the OfD programme shall be transformed into an Energy for Development (EfD) programme, which is in the process of being developed.
The policy of the Norwegian government is to integrate development and climate, as these major challenges are highly interlinked. Increased access and transition to renewable energy is the main priority. Renewable energy has been part of Norway’s development assistance policy for several years. In addition to extensive support through multilateral and multi-donor funding, several countries, mainly in Sub-Saharan Africa, have received bilateral Norwegian renewable energy funding. The overall objective of Norway’s contribution to renewable energy is to contribute to SDG 7 and the Paris Agreement. The intervention in renewable energy is also seen as a contribution to reduce further development of coal power. For further information, see chapter 15.4 of Norway’s National Inventory Report for 2022.
Norway has issued Instructions for Official Studies and Reports (Utredningsinstruksen), laid down by Royal Decree. These instructions deal with consequence assessments, submissions and review procedures in connection with official studies, regulations, propositions and reports to the Storting. The instructions are intended for use by ministries and their subordinate agencies. The instructions form part of the Government’s internal provisions and deviation may only be allowed pursuant to a special resolution. The provisions make it mandatory to study and clarify financial, administrative and other significant consequences in advance.
In addition, Norway has a legal framework that deals specifically with environmental impact assessments. The purpose is to promote sustainable development for the benefit of the individual, society and future generations. Transparency, predictability and participation for all interest groups and authorities involved are key aims, and it is intended that long-term solutions and awareness of effects on society and the environment will be promoted.
For Norway, the principles of just transition are crucial to the implementation of the Paris Agreement. The social dialogue between government, worker’s unions and employer’s organisations is an important foundation. The government of Norway has emphasized the creation of new, green businesses and workplaces, and at the same time contributing to the greening of existing jobs. In 2022, the Norwegian Council for Just Transition was formed, with an aim to discuss relevant aspects of climate policy that pertains to the workforce. The council is led by the Minister of Climate and Environment with participation from four national worker’s unions and four employer’s organisations. The council is a platform for discussions around effects of the green transition on the workplace and in the workforce. The council also discusses geographic and gender disparities. An aim for the Norwegian government is that the green transition takes place in a way that does not increase the social differences in the society.
Norway aims to ensure the equal and meaningful participation of civil society, including women and girls, in decision-making processes on climate change, both nationally and internationally. At the international level, Norway has advocated for and made efforts in order to ensure that the equal and meaningful participation and leadership of women in all aspects of the UNFCCC processes are included in relevant decisions under the UNFCCC and the Paris Agreement. Norway also promotes gender balance in all national delegations, including under the UNFCCC. To address the issue of underrepresentation of women in the UNFCCC processes, Norway announced a strengthened commitment on gender and climate change during the negotiation’s «Gender Day» at COP 26:
«Norway will work to increase and strengthen the role and impact of women and girls in both international and national climate decision-making. This includes working to increase the proportion of women and girls in the UNFCCC-processes and in national decision-making on climate policies. Norway will report on the results in its Biennial Transparency Report under the Paris Agreement.»
In 2022, the Nordic countries presented a commitment on gender equality and climate change, which was presented during the UN Commission on the Status of Women (CSW66). Through this, we have committed ourselves to promote international cooperation, build alliances and strengthen advocacy on the interconnections between climate action and gender equality. In 2022, Norway also hosted a roundtable on the topic «Gender Equality and Climate Justice», together with the women’s organization FOKUS and UN Women. The roundtable included ministers from several Nordic Countries, UN Women, actors from civil society and a number of business leaders. At COP 27, Norway hosted a high-level side event on gender and climate change, together with the African Union and UN Women.
On then national level, Norway has made arrangements for the participation of women’s organizations in relation to the preparation of the climate change negotiations. The Ministry of Climate and Environment has also arranged a number of courses for new climate change negotiators, which includes many young women. The courses have also been valuable for more experienced climate change negotiators. Norway is also proud to have had a Norwegian female representative for the role as the SBI Chair under the UNFCCC for the period 2020-2022. She is the fourth woman to ever have this role in history.
Norway will continue the work on gathering knowledge on and promoting the interlinkages between climate change and gender equality.
2.6 Summary of greenhouse gas emissions and removals
According to the MPGs, each Party that submits a stand-alone national inventory report shall provide a summary of its GHG emissions and removals in a tabular format. According to decision 5/CMA.3, the CTF table 6 should be in accordance with the common reporting table 10.
The ETF progress reporting tool is meant to populate CTF table 6 with inventory data from the ETF inventory reporting tool. However, CTF table 6 in the progress reporting tool has not been specified in accordance with CRT table 10, and hence CTF table 6 can’t be generated at the time this BTR was reported. For information contained in the CRT tables, see Norway’s submission at the UNFCCC website.24
2.7 Projections of greenhouse gas emissions and removals
2.7.1 Introduction
This chapter presents projections of greenhouse gas emissions and removals in Norway for the years 2025, 2030, 2035 and 2040. The baseline scenario is a «with measures» (WEM) projection, based on policies and measures implemented as of midyear 2024. A «with additional measures» (WAM) projection is also reported, see chapter 2.7.6. Historic emissions and projections both include indirect emissions of CO2. The previously reported projections were in Norway’s 8th National Communication and 5th Biennial Report (NC8/BR5) in 2022.
2.7.2 With existing measures (WEM) projections
Norwegian greenhouse gas emissions in 2022 without LULUCF were 48.9 million tonnes of CO2 equivalents. Estimates for 2023 that have not yet been reported to the UNFCCC show a significant reduction, to 46.7 million tonnes. Emissions for 2023 are estimated to be 9 per cent lower than in 1990 and 17 per cent below the emissions peak in 2007. This reduction has occurred in parallel with population growth and economic growth. In per capita terms, the emissions reduction is far greater, with a reduction of almost 30 per cent since 1990. Updated emissions projections for the period towards 2040 show that the reduction in emissions is expected to continue.
Table 2.8 shows Norway’s updated projections under the WEM-scenario for all sectors and gases for the period up to 2040. In 2040, Norwegian emissions without LULUCF are projected to be just under 28 million tonnes of CO2 equivalents; c.f. table 2.8. This is a reduction of almost 46 per cent from the 1990 level. The LULUCF sector contributed to a net uptake of about 13.7 million tonnes CO2 in 2022. The net uptake is projected to increase to about 16.6 million tonnes CO2 in 2025, and then decrease to about 7.8 million tonnes CO2 in 2040. CTF table 5 identifies the mitigation policies and measures, actions and plans that are included in the WEM projection.
Tabell 2.8 (CTF table 7) Information on projections of greenhouse gas emissions and removals under a ‘with measures’ (WEM) scenario
Most recent year in the Party’s national inventory report
Projections of GHG emissions and removals
(kt CO2 eq)
(kt CO2 eq)
2022
2025
2030
2035
2040
Sector
Energy
20770.00(2)
19 562,64
14 849,83
11 520,35
8 931,56
Transport
12 708,57
11 086,04
8 921,39
7 140,43
5 723,17
Industrial processes and product use
9327.40(1)
8 613,96
8 135,46
7 795,27
7 508,39
Agriculture
4 642,65
4 566,96
4 784,99
4 796,42
4 812,65
Forestry/LULUCF
-13 746,10
-16 602,32
-13 396,94
-10 901,81
-7 796,90
Waste management/waste
1 430,87
1 308,05
1 150,37
1 031,09
939,72
Other (specify)
Gas
CO2 emissions including net CO2 from LULUCF
26 605,99
20 410,14
16 635,05
13 839,65
12 761,87
CO2 emissions excluding net CO2 from LULUCF
40 807,82
37 482,09
30 507,88
25 224,30
21 049,41
CH4 emissions including CH4 from LULUCF
5 140,56
4 981,31
4 871,30
4 707,70
4 577,17
CH4 emissions excluding CH4 from LULUCF
4 921,20
4 760,35
4 647,43
4 480,25
4 346,06
N2O emissions including N2O from LULUCF
2 446,96
2 326,37
2 349,25
2 312,42
2 279,49
N2O emissions excluding N2O from LULUCF
2 210,60
2 077,70
2 097,24
2 057,02
2 019,96
HFCs
746,79
648,93
406,19
365,06
331,88
PFCs
122,19
93,9
98,25
102,56
107,4
SF6
70,9
74,67
85,05
54,35
60,78
NF3
Other (specify)
Total with LULUCF
35 133,39
28 535,32
24 445,09
21 381,74
20 118,59
Total without LULUCF
48 879,49
45 137,64
37 842,04
32 283,55
27 915,49
1Includes 3.88 kt CO2 indirect CO2 emissions as reported in CRT table 6. Indirect CO2 emissions are included in the projections, but are not specified per sector.
2Includes 120.68 kt CO2 indirect CO2 emissions as reported in CRT table 6. Indirect CO2 emissions are included in the projections, but are not specified per sector.
The WEM projection without LULUCF is illustrated in figure 2.7, together with the historic emissions and a with additional measures (WAM) projection (also without LULUCF). Estimates show that additional measures can lower the emissions in 2030 and 2035 by 4.8 and 5.2 million tonnes CO2 eq, compared to the WEM projection. Norway does not report a WAM-projection for the year 2040 since the effects of PaMs in the WAM-scenario have not been quantified for the year 2040. For more information about the WAM projection, see chapter 2.7.6.
Figur 2.7 Historic emissions and WEM and WAM projections without LULUCF (million tonnes CO2 equivalents)
Sources: Ministry of Climate and Environment and Ministry of Finance
Table 2.9 and figure 2.7 show historic emissions and removals and the WEM projection, distributed across sectors from the Norwegian Emission Inventory. Additionally, the table differentiates between EU ETS and ESR emissions, see chapter 2.3 for further details.
Tabell 2.9 Greenhouse gas emission and sequestration (million tonnes of CO2 equivalents)
1990
2005
2022
2030
2035
2040
Greenhouse gas emissions
51.3
54.8
48.9
37.8
32.3
27.9
EU ETS emissions
22.6
27.4
23.6
18.3
15.2
12.9
Oil and gas activities1
7.2
12.9
11.5
7.8
5.3
3.6
Mainland manufacturing, incl. mining2
14.6
13.4
10.7
9.3
8.8
8.3
Other3
0.7
1.1
1.5
1.2
1.1
1.0
Effort Sharing emissions
28.7
27.4
25.2
19.8
17.3
15.2
Road transport
7.4
9.5
8.7
5.3
3.8
2.7
Shipping,4 fisheries, machinery, etc.
4.6
5.5
6.6
5.6
5.0
4.3
Agriculture
5.0
4.7
4.6
4.8
4.8
4.8
Other5
11.7
7.7
5.3
4.1
3.7
3.4
Negative emissions
0
0
0
-0.2
-0.2
-0.2
+ Net sequestration in forests and other land areas
-11.8
-24.8
-13.7
-13.4
-10.9
-7.8
= Net greenhouse gas emissions
39.5
30.0
35.1
24.4
21.4
20.1
Memo:
Mainland Norway6
43.0
40.7
36.8
29.6
26.6
24.1
1Some of the oil and gas emissions are non-EU ETS emissions. These have been added to «other» Effort Sharing emissions.
2Some of the manufacturing emissions are non-EU ETS emissions. These have been added to «other» Effort Sharing emissions.
3Includes EU ETS emissions from energy supply and aviation.
4Includes all domestic shipping emissions, including those that are also EU ETS emissions.
5Includes Effort Sharing emissions from oil and gas activities, mainland manufacturing (incl. mining), energy supply, heating and other emission sources.
6Greenhouse gas emissions, excluding oil and gas activities.
Sources: Statistics Norway, Norwegian Environment Agency, Norwegian Institute of Bioeconomy Research and Ministry of Finance.
Figur 2.8 Greenhouse gas emissions1 by main sources in the Norwegian emissions inventory (million tonnes of CO2 equivalents)
Figur 2.9
1Historical emissions up to and including 2022. Projected emissions after 2022 are indicated by transparent colouration.
Sources: Statistics Norway, Norwegian Environment Agency and Ministry of Finance
2.7.3 Details for the WEM projections (without LULUCF)
2.7.3.1 Assumptions
The WEM-projection is the Ministry of Finance’s estimate of future greenhouse gas emissions in Norway based on assumptions about underlying trends in the Norwegian and international economy, including economic, technological and demographic aspects. Key assumptions are discussed in Box 2.1. It is assumed that current climate policy will remain unchanged, both in Norway and internationally. This means that proposed changes to policy instruments and measures that have not been fully examined or implemented in regulations or decisions of the Storting, etc., are not included in the projection. This also applies to measures presented in the Government’s proposed fiscal budget for 2025. In the projections, the rates of CO2 tax and other taxes and public grants are kept unchanged at the 2024 level. The projection therefore does not provide a description of the Government’s objectives or the effects of new climate policies and should not be considered a forecast of the most likely emissions development. Box 2.8 summarises some of the key climate policy changes since the previous projection.
Greenhouse gas emissions developments are uncertain. Emissions are closely linked to economic activity. Norway is a small, open economy, and emissions developments will be heavily influenced by international circumstances. As an example, lower economic growth among trading partners may lead to lower demand for emission-intensive exports, such as metals and fertilisers, thereby reducing Norwegian emissions. Technological development, which for the most part takes place outside Norway, is also of major importance to emissions development. However, it is notoriously difficult to predict technological breakthroughs. This uncertainty is illustrated by electric car sale developments in Norway. Value added tax exemption for electric passenger cars was introduced already in 2001, while exemptions from motor vehicle registration tax and road tolls came even earlier. However, electric car sales did not increase significantly until about 2018. By then battery technology had increased the range of electric cars, while the number of models available grew and the take up almost exploded; see figure 2.8. Since the projection is based on the assumption about continuation of current international climate policy, it is generally assumed that the development of new technology will follow historical trends. Major international breakthroughs may therefore lead to a faster reduction in Norwegian emissions.
Chapter 2.7.8 presents an analysis of how sensitive emissions development is to various assumptions about economic growth and technological progress. The 2024 white paper on Long-term Perspectives on the Norwegian Economy also presented alternative Norwegian emissions pathways under various assumptions about international technological development.
Table 2.10 lists the key macroeconomic projections underpinning the Norwegian emission projections. Box 2.7 explains key assumptions of the WEM projections, while box 2.8 lists differences the changes in policy.
Tabell 2.10 (CTF table 11) Key underlying assumptions and parameters used for projections
Key underlying assumption and parametersc
Unit, as applicable
Most recent year in the Party`s national inventory report, or the most recent year for which data are available
Projections of underlying assumtion/parametersd
2022
2025
2030
2035
2040
GDP
billion NOK, Fixed 2023 prices
4 286.00
4 494.00
4 704.00
4 881.00
5 038.00
GDP of which mainland Norway
billion NOK, Fixed 2023 prices
3 826.00
4 004.00
4 324.00
4 560.00
4 766.00
GDP of which petroleum activities and ocean transport
billion NOK, Fixed 2023 prices
461.00
495.00
405.00
348.00
302.00
Consumption
billion NOK, Fixed 2023 prices
2 928.00
3 116.00
3 400.00
3 681.00
3 908.00
Gross fixed capital formation
billion NOK, Fixed 2023 prices
690.00
706.00
819.00
803.00
790.00
Gross fixed capital formation of which mainland Norway
billion NOK, Fixed 2023 prices
466.00
435.00
599.00
613.00
610.00
Gross fixed capital formation of which petroleum activities and ocean transport
billion NOK, Fixed 2023 prices
224.00
272.00
220.00
190.00
180.00
Population
Thousands
5 425.00
5 600.00
5 750.00
5 880.00
5 994.00
Number of personsemployed
Thousands
2 822.00
2 875.00
2 911.00
2 917.00
2 913.00
Oil price
USD per barrel
98.00
78.60
79.30
87.50
96.70
Gas price
USD per M M Btu
33.10
11.50
7.90
8.40
9.00
Source: Ministry of Finance
Boks 2.7 Key assumptions underpinning the projections1
The projection is based on the emissions accounts, the reporting guidelines adopted by the parties to the UNFCCC and the national accounts from Statistics Norway. The projection is generated by Statistics Norway’s economic model SNOW2, whose input data are obtained from the National Account and the GHG inventory. The model is supplemented by other types of analyses in certain areas. The projection relies on detailed emissions data for 2022, which is the last year for which final data are available. For 2023, the projection therefore deviates somewhat from Statistics Norway’s provisional 2023 emissions accounts.
The projection is consistent with the macroeconomic pathway outlined in the national budget and the 2024 white paper on Long-term Perspectives on the Norwegian Economy: The emissions projection reflects developments in employment, production, oil and gas prices, public finances and the current account balance. Power production is in line with the provisional 2024 long-term power market analysis from the Norwegian Water Resources and Energy Directorate (NVE). EU ETS emissions allowance prices are projected on the basis of forward prices and interest rate levels. The resulting emissions allowance price estimate increases to about NOK 950 at 2024 prices in 2040. Other international prices are kept unchanged in real terms from the base year.
The projection assumes that current climate and environmental policy will be continued in Norway and internationally. Carbon tax rates, biofuel sales requirements and the level of transfers to Enova are therefore kept unchanged at 2024 levels. The biofuel blend ratio required for fuel sales is 10 per cent for non-road vehicles and 6 per cent for shipping and fisheries. For road transport, the actual biofuel blend ratio is estimated to be 15.5 per cent. This ratio is lower than the sales requirement due to the regulations on double counting of advanced biofuels.
It is assumed that the carbon capture and storage facility at the cement factory in Brevik will be completed in 2025. For the waste incineration plant at Klemetsrud, it is assumed, on an uncertain basis, that the carbon capture and storage facility will be completed in 2029. Completion of the Klemetsrud facility has been deferred by two years compared with the previous projection.
Box 2.7 continued
The projection of emissions from oil and gas activities is based on information from the Norwegian Offshore Directorate. The Norwegian Offshore Directorate estimates are primarily based on operators’ own plans and reports, along with onshore facility emission data.3 Petroleum activity-related emissions from maritime support services and helicopter transport are included in other emission sources.
Passenger car emissions are projected using a model developed by the Norwegian Environment Agency. The model generates emissions pathway projections based on assumptions about vehicle kilometre developments, electric car sales and biofuel sales requirements.
Based on activity data from the Norwegian Institute of Bioeconomy Research (NIBIO), the Norwegian Environment Agency prepares agricultural emissions projections. A certain degree of efficiency improvement is assumed, thereby gradually reducing emissions per unit produced somewhat over time.
1For more details, see Ministry of Finance (2024); «Documentation of assumptions underpinning greenhouse gas emissions projections for the National Budget 2025».
2Rosnes and Yonezawa (2024), The SNOW Model for Norway – SSB, Documents 2024/16, Statistics Norway
3Under this definition, oil and gas activities include all offshore petroleum installations, as well as the onshore facilities at Kollsnes, Sture, Nyhamna (Ormen Lange field), Hammerfest LNG facility (Snøhvit field), Mongstad (indirect emissions from crude oil terminal) and Kårstø.
Boks 2.8 Climate policy changes since the previous report
Projections of environmentally harmful emissions to air were last updated in the National Budget 2023 (and reported in NC8) and were based on the climate policy stance in the late summer of 2022. Since then, climate policy has been tightened. Some important changes are:
Taxes on emissions covered by the Effort Sharing Regulation have been increased from NOK 766 per tonne of CO2 in 2022 to NOK 1,176 in 2024. In addition, a carbon tax on nitrous oxide from mineral oil and on SF6 has been implemented at the general tax level of NOK 1,176. The tax on the combustion of fossil fuel waste has been increased from NOK 192 in 2022 to NOK 882 in 2024.
Road usage tax rates were reduced in 2023 and 2024. This should be considered in the context of the higher CO2 tax on mineral products, which would in itself serve to increase fuel prices.
A new weight component has been introduced in the motor vehicle registration tax for all vehicles. In addition, the rates of the CO2 component in the motor vehicle registration tax for passenger cars and vans have been increased, and the preferential treatment of plug-in hybrid cars for motor vehicle registration tax purposes has been discontinued.
From 1 January 2023, the value added tax exemption was abolished for passenger EVs with a value in excess of NOK 500,000.
From 1 July 2024, value added tax on the financial leasing and rental of passenger cars was restructured to a more neutral stance.
The biofuel blend ratio required for road transport fuel sales has been increased by almost 2 percentage points. In addition, a 10-per-cent biofuel blend ratio requirement was introduced for non-road transport fuel sales, including construction machinery, from 2023, while a 6-per-cent biofuel blend ratio requirement was introduced for shipping and fisheries fuel sales from Q4 2023.
The transfers to Enova have been increased by a total of NOK 3.0 billion in 2023 and 2024. The increased transfers are earmarked for emission reduction, technology development and industry restructuring.
Bionova was established in 2022, and its 2024 grant is about NOK 170 million. Bionova is charged with reducing greenhouse gas emissions in agriculture, forestry and aquaculture.
As of 2024, public procurement decisions are required to accord a 30-per-cent weighting to environmental considerations. In addition, the regulatory zero-emission requirement in public vehicle procurement has been tightened somewhat by bringing forward the city bus requirement by one year, thereby making it applicable from 2024. It may still be met by using biogas.
The projections in NC8 were based on GWP-100 values from IPCCs fourth assessment report, while GWP-100 values from the IPCCs fifth assessment report are used for the projections in this BTR.
2.7.3.2 Methods and models
The method and models used for the projections are described below. In the projections of this report, the SNOW-model has replaced the Excel spreadsheet model used in Norway’s NC8, for road transport except passenger cars. For passenger cars, the Excel spreadsheet model remains, c.f. description below. Additionally, the SNOW-model is improved since Norway’s NC8. The model has now a more detailed description of the Norwegian tax code; improved specification of free EUA’s; introduced biofuel in aviation, fishing, water transport and non-road machinery sectors; and an improved specification of the waste sector.
SNOW
The SNOW-model is a computable general equilibrium (CGE) model. The model gives a detailed description of the structures of economic policy, production and consumption in the Norwegian economy. Agents are represented as optimising individuals who interact with each other in national and international markets. Factor prices and prices of deliveries to the domestic markets are all determined by market equilibria. Consumption and savings result from the decisions of the representative household, which maximizes welfare, given income from labour, capital and natural resources.
The model is a recursive dynamic, integrated economy and emissions model that can project energy-related and process emissions based on macroeconomic assumptions. The model gives a detailed description of the production and consumption structures in the Norwegian economy. The model specifies 49 industries (45 private production sectors and 4 government sectors), classified to capture important substitution possibilities with environmental implications. The model includes 24 consumption goods with detailed description. Moreover, detailed description of governmental taxes and transfers such as environmental policy, trade policy, subsidies, tax rates, and real government spending is also included.
Producer behaviour is characterised by perfect competition. The main production factors are material inputs, labour, three types of real capital, five types of energy goods (incl. biomass) and various types of polluting and non-polluting transport services. For most commodities, a certain degree of substitution between production factors is assumed, depending on their relative prices and the exogenous assumptions about factor productivity developments. Labour and capital are perfectly mobile between sectors. In each sector, real capital formation is determined so that expected return on capital equals an exogenously given return on capital.
We model a small, open economy, which considers the world market prices and interest rate as exogenous. Domestic and foreign goods are assumed to be imperfect substitutes (Armington assumption). Together with a given balance of payments, the real exchange rate will be determined consistent with domestic consumption.
The model provides a relatively detailed description of the markets for energy and transport. A detailed emission module is incorporated into the SNOW model, turning it into an effective tool for assessing environmental consequences of changes in economic activity. Both emissions related to energy use and emissions from industrial processes are modelled. Energy-related emissions are linked in fixed proportions to the use of fossil fuels, with emission coefficients differentiated by the specific carbon content of the fuels. Various environmental and climate policy instruments are included, e.g., emission quotas, taxes and subsidies.
The intended field of application of the model is climate policy, tax reforms and sustainable public finance. The main input data categories and data sources are National accounts and official statistics on emissions. Outputs of the model are prices and quantities for all goods (monetary values, based on national accounts), GHG emissions, emissions of other pollutants, energy consumption, tax revenues and government spending. Gases covered by the model is domestic emissions of twelve pollutants (six GHG and six air pollutants) disaggregated by source and sector. The base year is 2018 with respect to trends, but the trends are calibrated to start at the emission level in 2020. Adjustments were made for sectors particularly affected by the pandemic. The model can be run to 2100. Population projections are from Statistics Norway. The model structure is top-down with bottom-up features. There are nested CES functions in production and consumption.
Projections of emissions of greenhouse gases other than CO2 are mainly based on sector- and plant-specific information, assessed by the Norwegian Environment Agency.
SNOW is a general model that simultaneously accounts for behavioural responses to a variety of policy instruments and other drivers. The model’s relatively rich variety of policy variables will give synergies between policies and measures (PaMs) when projecting emissions. However, the model only operates with, for example, average marginal tax rates and does not capture the richness of all policy instruments (e.g. differentiation in vehicle registration tax). One of the strengths of using an integrated macroeconomic and emission model like SNOW is that the model provides consistency between long-term economic forecasts and emission projections. The usual caveats of computable general equilibrium top-down approaches apply. One shortcoming of SNOW is its poor specification of new technologies (abatement options) in industries, but this is under development. Another shortcoming is the need for the outputs to be supplemented by the results from more disaggregated models and expert judgment.
Petroleum sector
The projections of emissions from oil and gas production have been prepared by the Norwegian Offshore Directorate (NOD) and are based on reporting from oil companies. Emissions from the petroleum sector in Norway are well documented. The industry’s own organisation, the Offshore Norge, has established a national database for reporting all releases from the industry, called EPIM Environment Hub (EEH). All operators on the Norwegian continental shelf report directly in EEH data on emissions to air and discharges to the sea. Oil companies operating on the Norwegian shelf must submit data annually, and forecast their respective operated fields, discoveries, transport and land facilities. The reporting includes corporate financial data, projects, resource volumes and forecasts for production, costs and environmental discharges/emissions. The NOD quality-assures and organises the data reported by the companies. The NOD also prepares its own estimates and classifies the resources based on its own assumptions. Based on the information from the companies, the NOD updates the resource accounts for the Norwegian shelf and prepares forecasts for production, costs and emissions.
Emissions of CO2 derive mainly from offshore generation of electricity, gas pipeline compressors, and from flaring for safety reasons. In addition, mobile facilities linked to a permanent facility in production generate some emissions.
In the projection, it is assumed that emissions depend on the infrastructure installed, instead of volume extracted. This modelling choice is because offshore power demand remains almost constant throughout the lifespan of the installation. As such, offshore CO2 emissions are but sparsely correlated with extraction volume.
Passenger cars
Emissions of CH4, N2O, CO2 from passenger cars are projected in a model. The model is based on data from the model used by Norway to estimate historical emissions from road traffic (Handbook of Emissions Factors (HBEFA) v5.1 using activity data for 1990–2022). Emissions are projected using time series estimates for the following parameters: population growth, kilometers driven per person for different vehicle classes, emission factors, biofuel blending, and a factor that adjusts for the discrepancy between fuel sales and bottom-up estimates of fuel consumption.
Projection data:
Activity, population – Statistics Norway
Activity, kilometers driven per person for different vehicle classes – expert estimates based on historical trends and background data in the National Transport Plan
Emission factors: trend by vehicle class (or by technology for light duty vehicles) – expert estimates • Biofuels: adopted quota obligations
Adjustment for the discrepancy between fuel sales and bottom-up estimates of fuel consumption – expert estimates
Agriculture sector
The Ministry of Agriculture and Food is responsible for the agriculture projections and order emission projections from the Norwegian Environment Agency (NEA), and projections for agricultural activity data from Norwegian Institute of Bioeconomy Research (NIBIO). Some basis requirements are given by Ministry of Finance, for example which population forecast the agriculture emission forecast should be based on. The Environment Agency specifies the activity data variables needed in Excel sheets including the historical figures for the same variables. The variables are discussed and include other experts when needed.
The emission projections are estimated with a forecasting tool including the complete agriculture sector and the tool is based on the same set of models and emission factors as are used for the historical emission inventory. This ensures that methodological changes in the inventory also are reflected in the projections. Descriptions of the methods and emission factors used in the emission inventory are given annually in chapter five of the Norwegian National Inventory Document (NID) and Annex 5b to the NID.
Projections for the agricultural activities from NIBIO are input to the forecasting tool. The projection of CH4, N2O and NH3 emissions from agriculture are based on projected development in animal stock. Animal numbers, which is dependent of expected population development from Statistics Norway, historical trend in production and consumption, assumptions in development in diets in the population and the growth and performance per animal.
For dairy cow is expected development in milk yield, nitrogen content in manure and excretion of organic material (VS) forecasted. Use of concentrate as part of total amount of feed, concentrate in kilograms TS per day and animal and the fat content in the concentrate, and the pasture time is also included in the forecast estimations for cows.
For young cattle are slaughter weight and slaughter age forecasted in the enteric methane estimations.
Total nitrogen need is projected, and how expected change in animal manure substitutes for synthetic fertiliser used. The development in tonnes for different crops harvested is also forecasted.
Development in area organic soils cultivated are based on historical trends in the LULUCF inventory. Some dependencies between different emission sources and variables are reflected in the forecasting-tool projections. Population forecast affects animal number forecast, crop production, mineral fertilizer use and use of liming in the emission projections. Also other dependencies between emission sources are included in the forecasting tool, as for example amount of nitrogen in mineral fertiliser and manure respectively, crop production trend also influences emissions from several emission sources in the inventory.
Solid waste disposal
The emissions model for estimating methane from Solid Waste Disposal Sites (SWDS) uses the model in the IPCC 2006 Guidelines. From 2009 deposition of wet organic waste on landfills is prohibited. The effect of this measure and all other policy measures concerning the waste sector are taken into account in the baseline scenario. The effect of licensing requirements for collection and combustion of methane from landfills is also taken into account in the projections. This implies that in the projection, only minor amounts of paper and sewage sludge are deposited, and this corresponds with Statistics Norway’s waste account. In the projection, about 12 per cent of produced methane is recovered. This equal to the actual recovery in 2022. Descriptions of the model for calculating CH4 from landfills are given annually in chapter 7 of the Norwegian NID.
Emissions of some sources under industrial process and product use (IPPU)
The Norwegian Environment Agency projects N2O emissions from nitric acid production and from the production of mineral fertilizers. This is based on the detailed information used for the GHG inventory. The projections of N2O emissions from nitric acid are based on information about the effect of a N2O reducing technology as of 2023. It is assumed an efficiency rate of 0.2 per cent per annum from 2024, and the production level is assumed to be constant at 2023-level. The emissions from the production of mineral fertilizers derive from the use of phosphate. The projections of are based on the implied emission factor (N2O emissions per unit production) for 2023, and the production level is assumed to be constant at 2023-level.
The Norwegian Environment Agency also estimates the emissions of sulphur hexafluoride (SF6) and hydrofluorocarbons (HFCs) based on models used for the GHG inventory. The assessment is based on how taxes and current regulations effect the respective emissions.
2.7.3.3 Projections
Projections of emissions to air were last presented in 2022, in the National Budget 2023. A modified version of this projection was presented in the National Budget 2024 due to revision of the emissions accounts in 2023. In 2023, Statistics Norway updated the emissions accounts to encompass new parameters for mapping emissions from metric tonnes to tonnes of CO2 equivalents. These so-called GWP (Global Warming Potential) values are in line with the reporting guidelines under the UNFCCC. The update increased estimated greenhouse gas emissions by between 0 and 0.6 per cent annually between 1990 and 2022.
The reduction in Norwegian greenhouse gas emissions is expected to continue. The projections estimate that emissions will on average decline by about 3 per cent annually until 2040 (see Figure 2.7 and Tables 2.8 and 2.9). In 2030 and 2040, emissions are projected to become 23 per cent and 43 per cent lower than in 2022, respectively. This development is primarily due to existing policy instruments making it attractive to improve and adopt more environmentally friendly technology and undertake other energy and emissions efficiency measures. On the other hand, the emissions reduction is dampened by expected economic growth and population growth. Emissions reduction towards 2040 is fairly equally divided between EU ETS emissions and Effort Sharing Regulation (ESR) emissions, with both decreasing by about 10 million tonnes of CO2 equivalents; see table 2.9.
Table 2.8 shows emissions specified by type of greenhouse gas. CO2 emissions increased from 1990 until 2015. As fossil fuel consumption has declined, partly because of increased electrification, CO2 emissions have declined. This trend is expected to continue, and the projection estimates that CO2 emissions will be almost halved by 2040, compared with 1990. Emissions of greenhouse gases other than CO2 have halved since 1990. These emissions are also expected to decline further, and emissions are projected to be almost 60 per cent lower in 2040 than in 1990.
Energy emissions are projected to decrease by 57 per cent between 2022 and 2040. The closure of the thermal power plant at Mongstad in 2023 is contributing somewhat to the reduction. Moreover, it is assumed, on an uncertain basis, that the carbon capture and storage facility at Klemetsrud will be completed in 2029. Some of the emissions captured at Brevik and Klemetsrud are from the incineration of biological material and are therefore «negative emissions». In 2030 and 2040, the negative emissions are projected to constitute 0.2 million tonnes of CO2; see table 2.9.
Most energy related emissions in Norway origin from oil and gas extraction, as 98 percent of electric power production in Norway is hydropower and wind turbine power.25 Oil and gas extraction accounts for the largest emissions reduction towards 2040, measured in equivalent tonnes. Emissions from oil and gas extraction are projected to decline by about two thirds compared with 2022. For comparison volume oil and gas extracted is projected to decrease by 35 per cent over the same period, as shown in table 2.9. The projections are subject to considerable uncertainty, and this uncertainty increases over time. The uncertainty relates, in particular, to future activity levels, infrastructure lifespans, future energy solutions and other potential emission-reducing measures; see Prop. 1 S (2024–2025) for the Ministry of Energy.26
Almost 97 per cent of emissions from oil and gas extraction in 2022 were CO2 emissions. The remainder of the emissions constitute just under 0.4 million tonnes of CO2 equivalents. These emissions are mainly methane from necessary cold ventilation, turbine operation and flaring, as well as emissions in connection with loading and storage. Methane emissions are expected to decline as production is gradually scaled back.
Emissions from transport are projected to decrease by 55 per cent between 2022 and 2040. The reduction in road transport emissions is expected to decline by about two thirds by 2040, compared with 2022. The emissions reduction comes despite an expected increase in vehicle kilometres in line with population growth; see figure 2.9. The reduction in emissions from road transport is mainly due to the continued replacement of cars with internal combustion engines by cars with electric vehicles (EVs). So far this year, about 85 per cent of new passenger cars sold have been electric; see figure 2.10. This share is projected to keep rising, but the time when 100 per cent of new passenger cars will be electric has been deferred somewhat from the previous projection.
Figur 2.10 Road transport emissions1. Left-hand axis: index 1990=100. Right-hand axis: million tonnes of CO2 equivalents
1Includes vans and lorries.
Sources: Statistics Norway, Norwegian Environment Agency and Ministry of Finance
The share of new vans and lorries with electric propulsion in new car sales has also started to increase, but the uptake is lagging some years behind passenger cars; see figure 2.10. So far in 2024, almost 30 per cent of new vans sold and just over 10 per cent of new lorries sold have been electric. This share is expected to continue to increase in the coming years, thereby helping to reduce road transport emissions.
Figur 2.11 Share of new vehicles with electric propulsion (per cent)
Sources: Norwegian Road Federation and Ministry of Finance
In non-road transport, emissions from construction machinery are projected to decline, as replacement of internal combustion engines for electric propulsion is expected to continue. Aviation emissions are projected to decline somewhat. Less travel after the pandemic and more emission-efficient aircrafts explains the reduction. In shipping and fisheries, further development of emission-reducing technologies, such as seagoing vessels that can use hydrogen, contributes to decreased emissions. Lower demand for supply services for the oil and gas operations contributes to dampened shipping activity. On the other hand, emergence of offshore wind turbine power may increase the demand for supply services. From 2024, some of the domestic shipping emissions are covered by the EU ETS, while at the same time being part of the ESR. In table 2.9, these are classified as ESR emissions in their entirety.
Emissions from mainland industry27 are projected to decline by about 20 per cent by 2040, compared with 2022. Increases in activity is expected to be offset by more efficient and less emission-intensive inputs, thus resulting in emissions decreasing gradually. Part of the emissions reduction by 2040 is due to the assumption that the carbon capture and storage project at Brevik will come to fruition; see Box 2.7. In addition, emissions from the refining of crude oil are projected to decline as demand for petrol and diesel for transport falls.
Agricultural production is projected to increase in line with population growth, thereby maintaining the self-sufficiency rate of agricultural foods. The emissions effect of increased production is offset by the expectation of somewhat lower emissions per unit produced. In total, emissions are projected to remain fairly stable towards 2040. Agriculture accounts for the majority of methane and nitrous oxide emissions; 57 per cent and 77 per cent, respectively, in 2022. These emissions are largely the result of feed digestion in ruminants and fertilisation.
While agricultural methane and nitrous oxide emissions are projected to remain fairly stable, total emissions of both methane and nitrous oxide are expected to decline. The reduction in methane emissions is explained by the ban on solid waste disposal , while the nitrous oxide emissions reduction is assumed to primarily come from further improvements in fertiliser production catalysts.
F-gas emissions that cause global warming are expected to decline further towards 2040. These are emissions from perfluorocarbons (PFCs), SF6 and HFCs, which came to a total of 0.9 million tonnes of CO2 equivalents in 2022. The introduction of the revised EU F-Gas Regulation, which caps emissions, is projected to more or less halve HFC emissions towards 2040. PFC and SF6 emissions are expected to remain fairly stable.
Figure 2.11 illustrates that per capita emissions are expected to decline more rapidly than total emissions. The distance between the emissions curve (blue curve) and the per capita emissions curve (red curve) represents the isolated emissions effect of population growth. In 2040, population growth is projected to increase emissions by approximately 6 per cent of the 2022 emissions level, when considered in isolation. This effect is somewhat larger than in the previous projection due to Statistics Norway’s upward revision of future population growth. The figure also illustrates that emissions per unit produced (grey curve) are expected to decline more rapidly than per capita emissions, due to technology and production efficiency improvements.
Figur 2.12 Projected greenhouse gas emissions in mainland Norway (index 2022=100)
Source: Statistics Norway and Ministry of Finance
2.7.4 Details for the WEM projections for LULUCF
2.7.4.1 Details for LULUCF
Net removals in the Land use, land-use change, and forestry (LULUCF) sector have increased since 1990. The increase is mainly due to large-scale afforestation and active forest management after the Second World War, reaching a peak in 2009 (Figure 2.12). Since the NC8/BR5, annual removals in the LULUCF sector have been significantly reduced. This is due to reduced growth, increased harvest, increased mortality, reduced forest area, as well as methodological changes. Projections show that removals are expected to decrease towards 2050. The reasons for this are a combination of an increasing proportion of older forests that are no longer in their most productive phase, increased harvesting due to more mature timber becoming available in the future, and lower investments in silviculture in recent decades. After 2050, removals are expected to stabilize and then increase towards 2100, see Table 2.11.
Tabell 2.11 Net removals (million tonnes CO2 equivalents) in the LULUCF sector (historic and projections)
2025
2030
2035
2040
2050
2075
2100
LULUCF
- 16.6
- 13.4
- 10.9
- 7.8
- 7.0
- 7.9
- 12.7
Figur 2.13 Historical emissions (1990–2022) and projections (2023–2100) for LULUCF
Source: Norwegian Institute of Bioeconomy Research
The projections are based on data and methodology from Norway’s national greenhouse gas inventory in 2022. The projections (dotted line) show the expected development in the sector where only the effect of already implemented measures is included.
2.7.4.2 SiTree model
The projections for the LULUCF-sector28 are based on data from the Norwegian Forest Inventory covering 1990–2022 and according to methods described in NIR2024. SiTree simulates growth, mortality, and ingrowth in all the NFI plots for managed forest land. SiTree is a single tree growth simulator and is a publicly available R package29 , and functions for growth, mortality, ingrowth and regeneration, and management are user-defined. The emissions and removals of total soil organic C (dead wood, litter, and soil pools) from forest land on mineral soil are estimated using the decomposition model Yasso07. Final felling and thinning intensities were estimated based on the observed intensities in the reference period (2009–2022). Thinning and harvest intensities in the reference period define the per cent of the area that should be managed at each period. Within each stratum and maturity group, plots are ranked according to the probability of harvest.
The emission projection from land other than forest lands uses the reference period 2009 to 2022 to estimate the change to and from the different land classes until 2100.
2.7.5 Main differences in WEM from previously reported WEM
Norway’s previously reported projections were in the NC8/BR5. Table 2.12 compares the WEM projection in this BTR with the WEM projection reported in the NC8. Except for LULUCF and energy, there are but minor differences. These projections are, however, not directly comparable. The projections in NC8 were based on GWP-100 values from IPCCs fourth assessment report, while GWP-100 values from the IPCCs fifth assessment report are used for the projections in this BTR. There have also been methodological changes in the inventory, especially for the LULUCF sector. In the LULUCF sector, reduced growth, increased harvest, and increased mortality as well as methodological changes, have significant revised projected emissions compared to the previous report.
Projected energy emissions in 2035 are 14 per cent lower than previously reported. This reduction is largely caused by lower projected emission from oil and gas extraction. The reduction in projected energy emissions is slightly dampened by the GWP value revision. Projected transport emissions are 6 per cent higher than previously reported. This increase is mostly due to the GWP value revision.
Tabell 2.12 Changes in GHG projections compared with NC8 by sector (ktonnes CO2 eq)
Sector
2025
2030
2035
20401
Energy excl. transport
-215
-1087
-1918
NA
Transport
458
330
405
NA
Industry/industrial processes
-135
-334
-371
NA
Agriculture
-32
74
80
NA
Forestry/LULUCF
-726
3143
2703
NA
Waste management/waste
303
285
273
NA
Total with LULUCF
-348
2412
1173
NA
Total without LULUCF
379
-731
-1530
NA
1Comparisons for 2040 are not relevant since the NC8/BR5 projections ended in 2035.
Sources: Statistics Norway, Norwegian Environment Agency, Norwegian Institute of Bioeconomy Research and Ministry of Finance
2.7.6 With additional measures (WAM) projection
Chapter 2.5.11 describes planned measures proposed by the government in the Climate status and plan, which have not yet been adopted by the parliament. These additional PaMs are included in the WAM-projection.
Tabell 2.13 Effect of PaMs included in the WAM-projection (kilotonnes CO2 equivalents)
2025
2030
2035
2040
Energy excl. transport
61
459
430
NE
Transport
274
3854
4306
NE
Industrial processes and product use
0
0
0
NE
Agriculture
50
220
220
NE
LULUCF
0
0
0
NE
Waste
0
240
240
NE
Total
385
4773
5195
NE
Source: Ministry of Finance and Ministry of Climate and Environment
The planned PaMs are expected to primarily reduce emissions of CO2, but there are also some emission reductions for CH4, N2O and HFCs, see Table 2.14 (CTF table 8) for details. The effects of the planned PaMs take into consideration the effects of existing PaMs in the WEM scenario and are adjusted to avoid overlapping effects. Norway does not report a WAM-projection for the year 2040 since the effects of PaMs in the WAM-scenario have not been quantified for the year 2040.
Tabell 2.14 (CTF table 8). Information on projections of greenhouse gas emissions and removals under a ‘with additional measures’ (WAM) scenario.
Most recent year in the Party’s national inventory report
Projections of GHG emissions and removals
(kt CO2 eq)
(kt CO2 eq)
2022
2025
2030
2035
2040
Sector
Energy
20 770,00
19 501,99
14 390,59
11 090,53
NE1
Transport
12 708,57
10 811,99
5 067,19
2 834,83
NE
Industrial processes and product use
9 327,40
8 613,96
8 135,46
7 795,27
NE
Agriculture
4 642,65
4 516,96
4 564,99
4 576,42
NE
Forestry/LULUCF
-13 746,10
-16 602,32
-13 396,94
-10 901,81
NE
Waste management/waste
1 430,87
1 308,05
910,37
791,09
NE
Other (specify)
Gas
CO2 emissions including net CO2 from LULUCF
26 605,99
20 119,24
12 477,14
9 270,56
NE
CO2 emissions excluding net CO2 from LULUCF
40 807,82
37 191,19
26 349,98
20 655,21
NE
CH4 emissions including CH4 from LULUCF
5 140,56
4 939,70
4 413,31
4 240,78
NE
CH4 emissions excluding CH4 from LULUCF
4 921,20
4 718,74
4 189,43
4 013,33
NE
N2O emissions including N2O from LULUCF
2 446,96
2 274,19
2 194,14
2 154,26
NE
N2O emissions excluding N2O from LULUCF
2 210,60
2 025,52
1 942,12
1 898,87
NE
HFCs
746,79
648,93
403,77
363,81
NE
PFCs
122,19
93,9
98,25
102,56
NE
SF6
70,9
74,67
85,05
54,35
NE
NF3
NO
NO
NO
NO
NE
Other (specify)
Total with LULUCF
35 133,39
28 150,63
19 671,66
16 186,33
NE
Total without LULUCF
48 879,49
44 752,94
33 068,61
27 088,13
NE
1Norway does not report a WAM-projection for the year 2040 since the effects of PaMs in the WAM-scenario have not been quantified for the year 2040.
2.7.7 Without measures (WOM) projection
A WOM-scenario without effects of policies and measures adopted since 1990 was illustrated in Norway’s NC8. This was possible since estimated effects of PaMs reported for the years 2020, 2025, 2030 and 2035 were combined with reported effects for 1995, 2000, 2005, 2010 and 2015 from the 7th National Communication. In this BTR1, Norway reports estimated effects for some PaMs only for the years 2020 and 2030. There are therefore no longer consistent numbers/estimates available to report or illustrate a WOM-scenario from 1990.
2.7.8 Sensitivity analysis
Emission projections are uncertain. In addition to future climate policy tightening, the projections are sensitive to, inter alia, economic growth and technological development assumptions. Figures 2.13 and 2.14 illustrate this by four alternative emissions pathways.
Figure 2.13 indicates how sensitive emissions development is to other economic activity assumptions. In the projection, average annual mainland GDP growth is 1 per cent between 2024 and 2040. If mainland GDP growth is halved from 2025, to an average of 0.5 per cent, the calculations shown in Figure 2.13 show that emissions may be 2.1 million tonnes of CO2 equivalents lower in 2040 than in the projection (blue curve). The grey curve shows a pathway in which annual GDP growth doubles to 2 per cent from 2025 onwards. In this scenario, emissions are 2.2 million tonnes higher than in the projection.
Figure 2.14 illustrates the emissions effect of alternative assumptions about future technological developments. In the grey curve pathway, technological development is assumed to accelerate, with an annual improvement of 1 per cent over and above the projection, i.e. an improvement of about 16 per cent in 2040. In this scenario, emissions are projected to decline by a further 1.2 million tonnes of CO2 equivalents in 2040, on top of the projection. Conversely, weaker technological progress may increase emissions. The blue curve shows a pathway in which annual technological development is 1 per cent lower than in the projection, corresponding to a reduction in technological progress of about 16 per cent. In this scenario, emissions increase by 1.3 million tonnes of CO2 equivalents in 2040, compared with the projection.
The 2024 white paper on Long-term Perspectives on the Norwegian Economy30 also presented an emissions pathway for Norway with significantly accelerated technology development as a result of countries following up on their targets and ambitions so as to attain the Paris Agreement temperature goal; see a summary of the analysis in Box 2.7.
Figur 2.14 Alternative emissions pathways for economic growth (million tonnes of CO2 equivalents)
Sources: Ministry of Finance and Statistics Norway
Figur 2.15 Alternative emissions pathways for technology development (million tonnes of CO2 equivalents)
Sources: Ministry of Finance and Statistics Norway
2.6.9 Projections of long-range air pollutants
Emissions of long-range air pollutants are regulated under the Gothenburg Protocol. These are nitrogen oxides (NOX), sulphur dioxide (SO2), ammonia (NH3), non-methane volatile organic compounds (NMVOC) and particulate matter (PM2,5). Such pollutants are spread across national borders via the atmosphere and contribute to, inter alia, acidification, eutrophication, harmful particle concentrations and ground-level ozone formation. Upon revisions of the Gothenburg Protocol in 2012, the parties undertook new emission commitments that apply from 2020.
Emissions of long-range air pollutants are shown in table 2.15. NOX emissions declined by 32 per cent from 1990 to 2022, and emissions have been lower than the Gothenburg commitment since its introduction in 2020. The reduction is primarily caused by lower road transport emissions due to stricter exhaust emission requirements. In recent years, an increasing share of electric cars has also contributed. There has also been a reduction in emissions from shipping and fisheries. Emissions from oil and gas activities have increased by 48 per cent since 1990, but have declined steadily since 2014. NOX emissions are projected to decline further, and to more than halve by 2040. This decline is partly attributable to expected vehicle emission reduction as internal combustion engines are phased out. In addition, shipping emissions are expected to decrease significantly as a result of the transition to low- and zero-emission technologies. NOX emissions are thus well below the Gothenburg commitment to cut emissions by 23 per cent from 2005 levels.
Sulphur dioxide (SO2) emissions have declined by 71 per cent between 1990 and 2022. Emissions are projected to continue to decline somewhat towards 2040. These emissions are also well below the Gothenburg commitment of a 10-per-cent SO2 emissions reduction from 2005 levels.
Non-methane volatile organic compound (NMVOC) emissions were 55 per cent lower in 2022 than in 1990. Lower emissions from the loading and storage of crude oil on the Norwegian continental shelf are the main contributing factor. In addition, NMVOC emissions from road transport have been declining for a long time, partly as a result of changes in vehicle fleet composition. Norway met its Gothenburg commitment for NMVOCs in 2020 and 2022. In 2021, however, emissions were 2 per cent higher than permitted under the Gothenburg Protocol. This was due to increased disinfectant use during the pandemic. From 2022, NMVOC emissions are projected to decline further and remain well below the commitment of a 40-per-cent reduction from the 2005 emission level.
Ammonia (NH3) emissions come primarily from livestock manure handling. This causes agriculture to account for 95 per cent of emissions. The Gothenburg commitment requires an 8-per-cent reduction in ammonia emissions from the 2005 level. As Norway has struggled to comply with this emission commitment, ammonia emissions reduction efforts have been prioritised in the general agricultural sector agreement in recent years. Emissions have declined somewhat in recent years due to changes in the vehicle fleet and agricultural efforts, but not by enough to ensure compliance with the commitment. Provisional figures for 2023 show that the commitment was met that year.
Emissions are projected to increase somewhat, and thus show a risk of non-compliance in the years to come.
Particulate matter (PM2,5) emissions have declined by 38 per cent from 1990 to 2022. When the Gothenburg Protocol was revised in 2012, Norway committed to a 30-per-cent particle emissions reduction in 2020 compared with the 2005 level. This was complied with in 2020. However, increased wood burning as a result of high electricity prices meant that emissions were higher than the commitment in 2021 and 2022. These emissions are expected to decrease in the years to come. The 2023 emissions accounts are expected to again show compliance with the Gothenburg commitment.
Tabell 2.15 Emissions of long-range air pollutants (1,000 tonnes)
1990
2005
2022
2030
2035
2040
Gothenburg Protocol
Nitrogen oxides (NOX)
198.2
210.4
135.6
91.2
73.0
58.9
160.9
Sulphur dioxide (SO2)
49.5
23.0
14.4
12.2
11.6
11.0
20.7
Non-methane volatile organic compounds (NMVOC)
319.6
243.9
144.0
129.5
122.2
119.1
149.6
Ammonia (NH3)
31.2
31.6
29.5
30.3
30.2
30.2
28.0
Particulate matter (PM2,5)
43.9
39.1
27.2
24.2
23.3
22.5
26.0
Sources: Statistics Norway, Norwegian Environment Agency and Ministry of Finance
2.7.9 Projections of black carbon
Chapter 1.3 of this BTR briefly describes the historic emissions of black carbon in Norway. According to the projections reported to the UNECE in 2023, the emissions of black carbon are expected to reduce further towards 2035 (Figure 2.15).
Figur 2.16 Historical emissions of black carbon in Norway 2022, and projections for 2025, 2030 and 2035
Source: Norway’s reporting to the UNECE
Footnotes
7Mainland Norway consists of all domestic production activity, except exploration of crude oil and natural gas, transport via pipelines and ocean transport
8A field is one or more petroleum deposits, which together are comprised by an approved plan for development and operation (PDO) or for which exemption from the PDO requirement has been granted.