1 National inventory report
1.1 Background
Norway’s national inventory report, consisting of the national inventory document (NID) and the common reporting tables (CRT) is reported as a stand-alone report and not as a component of this biennial transparency report. This is available at the UNFCCC website. 1
The NID for the year 2024 covers the inventory for the years 1990-2022. It has been prepared in accordance with the modalities, procedures and guidelines in the annex of decision 18/CMA.1 and is structured in line with the annex of decision 5/CMA.3. The reporting of Norway’s greenhouse gas inventory also includes the associated CRT tables. The NID and the CRT tables serve as Norway’s reporting both under the Paris Agreement and under the Convention.
The methodologies used in the calculation of emissions are consistent with the 2006 IPCC Guidelines for National Greenhouse Gas Inventories supplemented by aspects of the 2019 Refinement to the 2006 IPCC Guidelines for National Greenhouse Gas Inventories (2019 IPCC Refinement), and the 2013 Supplement to the 2006 IPCC Guidelines for National Greenhouse Gas Inventories: Wetlands (IPCC 2013 Wetlands Supplement). As recommended by the IPCC Guidelines, country specific methods have been used where appropriate.
The Norwegian Environment Agency, a directorate under the Norwegian Ministry of Climate and Environment, is responsible for the reporting. Statistics Norway has been the principal contributor while the Norwegian Institute of Bioeconomy Research is responsible all information regarding Land Use, Land Use Change and Forestry.
Since Norway submits a stand-alone national inventory report, only a summary of the GHG emissions and removals are reported in this BTR.
1.2 Summary of greenhouse gas emissions and removals
If not otherwise specified, total emission figures include indirect CO 2 emissions, 2 but not emissions and removals from land use, land-use change and forestry (LULUCF). In 2022, total greenhouse gas (GHG) emissions in Norway were 48.9 million tonnes of carbon dioxide equivalents, which is a decrease of 0.4 million tonnes compared to 2021. Emissions reached their peak at 56.4 million tonnes in 2007. They have since decreased by 13 per cent, and were in 2022 2.4 million tonnes, or 4.6 per cent, lower than in 1990. The net GHG emissions, including all sources and sinks, were 35.1 million tonnes of CO 2 equivalents in 2022. The total emissions distribution among the CRT sectors from 1990 to 2022, as well as net removals in the LULUCF sector, are illustrated in Figure 1.1.
Figur 1.1 Total emissions of greenhouse gases by sources and removals from LULUCF in Norway, 1990–2022 (million tonnes of CO 2 equivalents)
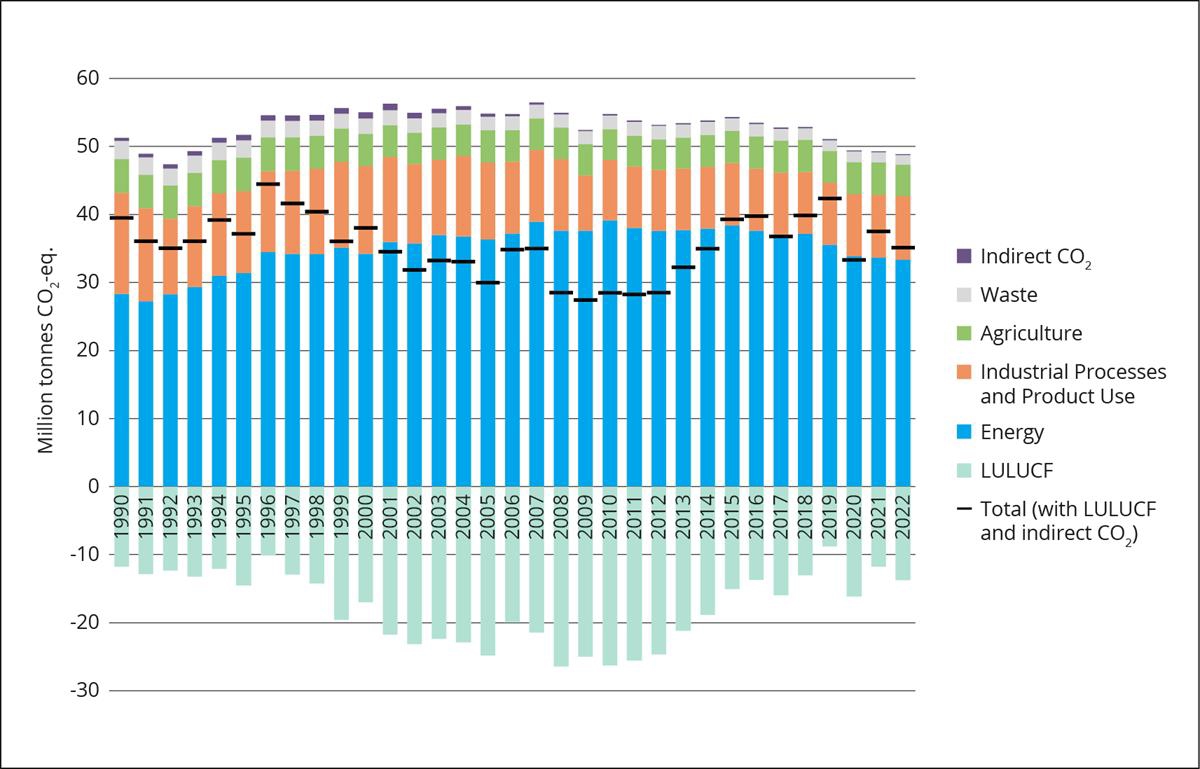
Source: Statistics Norway/Norwegian Environment Agency/Norwegian Institute of Bioeconomy Research
The emissions and removals are also shown in Table 1.1
Tabell 1.1 Total emissions of greenhouse gases by sources and removals in Norway 1990-2022 (million tonnes of CO2 equivalents)
|
Year |
Energy |
Industrial processes and product use |
Agriculture |
LULUCF |
Waste |
Indirect CO 2 emissions |
Total with indirect CO 2 and without LULUCF |
Total with indirect CO 2 and with LULUCF |
Total without indirect CO 2 and without LULUCF |
Total without indirect CO 2 and with LULUCF |
|---|---|---|---|---|---|---|---|---|---|---|
|
1990 |
28.3 |
14.8 |
5.0 |
-11.8 |
2.7 |
0.5 |
51.3 |
39.5 |
50.8 |
39.0 |
|
1995 |
31.4 |
12.0 |
4.9 |
-14.5 |
2.6 |
0.8 |
51.7 |
37.1 |
50.9 |
36.4 |
|
2000 |
34.2 |
12.9 |
4.7 |
-17.0 |
2.3 |
0.9 |
55.0 |
38.0 |
54.1 |
37.1 |
|
2005 |
36.3 |
11.3 |
4.7 |
-24.8 |
2.0 |
0.4 |
54.8 |
30.0 |
54.4 |
29.6 |
|
2010 |
39.2 |
8.9 |
4.5 |
-26.3 |
2.0 |
0.2 |
54.7 |
28.4 |
54.6 |
28.3 |
|
2011 |
38.0 |
9.0 |
4.5 |
-25.6 |
2.1 |
0.2 |
53.8 |
28.2 |
53.6 |
28.1 |
|
2012 |
37.6 |
8.9 |
4.5 |
-24.6 |
2.0 |
0.1 |
53.2 |
28.5 |
53.0 |
28.4 |
|
2013 |
37.7 |
9.0 |
4.5 |
-21.2 |
2.0 |
0.2 |
53.4 |
32.2 |
53.2 |
32.0 |
|
2014 |
37.9 |
9.1 |
4.6 |
-18.9 |
1.9 |
0.2 |
53.8 |
34.9 |
53.6 |
34.8 |
|
2015 |
38.4 |
9.2 |
4.7 |
-15.1 |
1.9 |
0.2 |
54.3 |
39.3 |
54.1 |
39.1 |
|
2016 |
37.7 |
9.1 |
4.7 |
-13.7 |
1.8 |
0.2 |
53.5 |
39.8 |
53.3 |
39.6 |
|
2017 |
37.1 |
9.1 |
4.7 |
-16.0 |
1.7 |
0.2 |
52,7 |
36,8 |
52,6 |
36,6 |
|
2018 |
37.2 |
9.1 |
4.7 |
-13.0 |
1.7 |
0.2 |
52.8 |
39.8 |
52.7 |
39.7 |
|
2019 |
35.6 |
9.1 |
4.7 |
-8.8 |
1.6 |
0.2 |
51.1 |
42.3 |
50.9 |
42.2 |
|
2020 |
33.8 |
9.1 |
4.7 |
-16.1 |
1.6 |
0.2 |
49.4 |
33.3 |
49.3 |
33.1 |
|
2021 |
33.6 |
9.3 |
4.8 |
-11.7 |
1.5 |
0.1 |
49.3 |
37.5 |
49.1 |
37.4 |
|
2022 |
33.4 |
9.3 |
4.6 |
-13.7 |
1.4 |
0.1 |
48.9 |
35.1 |
48.8 |
35.0 |
Source: Statistics Norway/Norwegian Environment Agency/Norwegian Institute of Bioeconomy Research
The energy sector is by far the most important source of GHG emissions in Norway, contributing to 68 per cent of the national GHG emissions in 2022. The major sources of emissions within the energy sector are energy industries and transport, which both contributed to 38 per cent of emissions from the energy sector in 2022. The GHG emissions from the energy sector increased by 18 per cent from 1990 to 2022. This was primarily due to increased activity within oil and gas extraction and transport, specifically road transportation. Since 2015, emissions have decreased by 13 per cent. From 2021 to 2022, emissions decreased by 0.8 per cent.
The Norwegian electricity production is dominated by hydroelectric power. Thus, emissions from the category energy industries origin almost completely from fuel combustion in oil and gas extraction and related activities.
GHG emissions from road transportation increased by 17 per cent from 1990 to 2022, mainly due to the increase of activity in goods transport, as a response to increased population and higher economic activity. Emissions from road transport went up considerably from 1990 until 2007. They then were relatively stable until 2015 and have since plunged by 15 per cent from 2015 to 2022. In 2022 they contributed to 18 per cent of the national GHG emissions. The downward trend from 2015 – is primarily a result of increased sales of electric vehicles due to economic incentives and a blending requirement of biofuels that has led to increased consumption of bio diesel and bio ethanol and hence reduced CO 2 emissions.
The industrial processes and other product use (IPPU) sector accounted for 19 per cent of the national GHG emissions in 2022. The emissions from this sector decreased by 37 per cent from 1990 to 2022. The downward trend in GHG emissions can be explained by the implementation of policies and measures in the metal industry, resulting in less emission intensive production methods. Later, in the 2000s, the decrease was largely caused by close-downs and production reductions, this also mainly in the metal industry.
In 2022, 9.5 per cent of the national GHG emissions originated from agriculture, corresponding to 4.6 million tonnes of CO 2 equivalents. Emissions from agriculture have decreased by 6.8 per cent since 1990. The largest sources of GHGs within the agriculture sector are enteric fermentation (CH 4 ) and agricultural soils (N 2 O). In 2022, these categories represented 52 per cent and 33 per cent of the emissions from the agriculture sector, respectively, while manure management represented 12 per cent. The main driver behind the emission trend in agriculture is the development of the number of animals in the dominant animal groups. Important reasons for the decreasing trend in GHG emissions are use of more concentrate and more effective milk production, which have led to a reduction of the number of dairy cows. For beef cows there has instead been an increase in the animal numbers since 1990.
The LULUCF sector includes both emissions of greenhouse gasses to the atmosphere, and removal of atmospheric CO 2 . The balance of the two is the net emissions or removals in the LULUCF sector. The changes in carbon depend upon several factors such as growing conditions, harvest levels, management practices and land use changes (area distribution). In 2022, the net removal in the LULUCF sector was 13.7 million tonnes CO 2 equivalents, which corresponds to about 28 per cent of the national GHG emissions (from all other sectors than LULUCF) that year. Forest land, grasslands and harvested wood products had net removals in 2022, while emissions came from cropland, settlements and wetlands (about 4.7 million tonnes of CO 2 equivalents). Forest land was the major contributor to the net sequestration of CO 2 in the sector, with total net removals of 17.9 million tonnes of CO 2 .
The waste sector, with emissions of 1.4 million tonnes of CO 2 equivalents in 2022, accounted for 2.9 per cent of the national GHG emissions. This sector includes emissions from landfills, wastewater handling, biological treatment of solid waste and small-scale waste incineration. Waste incineration with utilization of energy is included in the energy sector.
Solid waste disposal on land (landfills) is the main source category within the waste sector. It accounted for 61 per cent of the sector’s total emissions in 2022. Wastewater handling accounted for 19 per cent, waste incineration for 15 per cent, and biological treatment of solid waste accounted for 4.6 per cent. The downward trend in GHG emissions from the waste sector is due to reductions of waste amounts disposed at disposal sites.
As shown in Figure 1.2, CO 2 is by far the largest contributor to the total GHG emissions, followed by CH 4 , N 2 O, and the fluorinated gases (PFCs, SF 6 and HFCs).
Figur 1.2 Distribution of emissions of greenhouse gases in Norway by gas in 2022 (CO 2 equivalents)
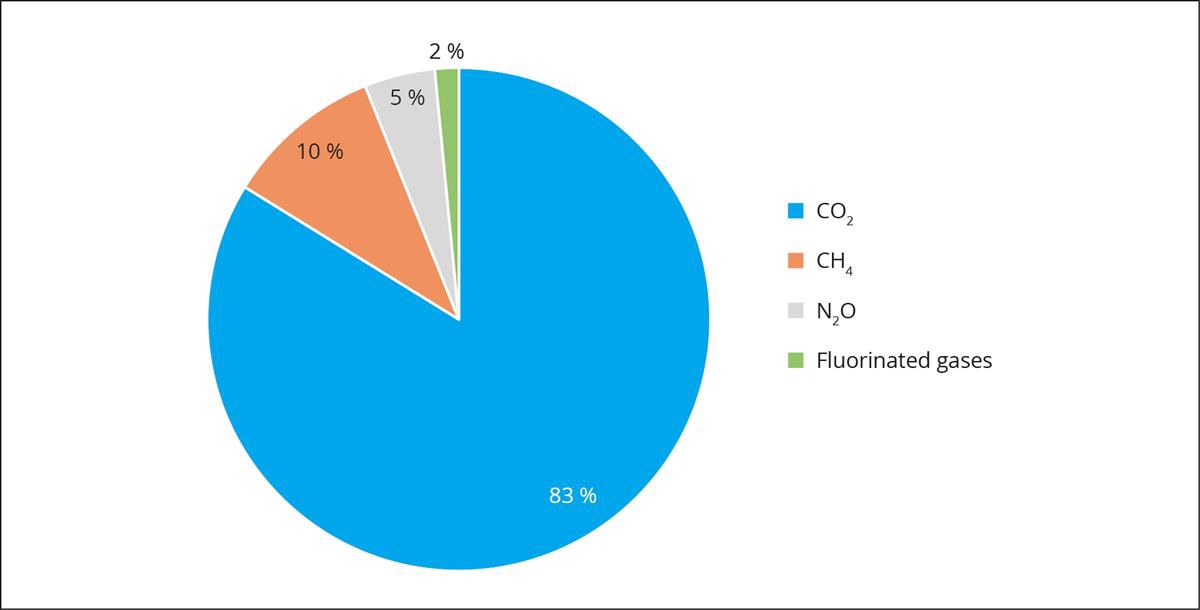
Source: Statistics Norway/Norwegian Environment Agency
Table 1.2 shows that the CO 2 emissions increased significantly from 1990 to 2022 with 5.8 million tonnes. Emissions of CH 4 and N 2 O decreased by 1.9 and 1.6 million tonnes CO 2 equivalents, respectively. During the same period, PFCs and SF 6 emissions significantly decreased with 3.4 and 2.1 million tonnes CO 2 equivalents, respectively, while HFCs has increased from almost 0 to 0.7 million tonnes CO 2 equivalents. The fluorocarbons constituted a larger share of the GHG emission total in the early 1990s than in 2022, while CO 2 represented a smaller share in 1990 than in 2022.
Tabell 1.2 Emissions in million tonnes of CO2 equivalents and changes in per cent for each greenhouse gas
|
CO 2 |
CH 4 |
N 2 O |
PFCs |
SF 6 |
HFCs |
Total with indirect CO 2 and without LULUCF |
|
|---|---|---|---|---|---|---|---|
|
1990 |
35.0 |
6.8 |
3.8 |
3.5 |
2.2 |
0.0 |
51.3 |
|
2021 |
41.0 |
5.0 |
2.2 |
0.2 |
0.1 |
0.7 |
49.3 |
|
2022 |
40.8 |
4.9 |
2.2 |
0.1 |
0.1 |
0.7 |
48.9 |
|
Changes 1990–2022 |
16.6 % |
-27.5 % |
-42.0 % |
-96.5 % |
-96.7 % |
1,503,091.8 % |
-4.6 % |
|
Changes 2021–2022 |
-0.5 % |
-1.0% |
-0.4 % |
-45.1 % |
-1.4 % |
0.5% |
-0.8 % |
Source: Statistics Norway/Norwegian Environment Agency
1.3 Black carbon emissions
Decisions 18/CMA.1 and 5/CMA.3 do not require the reporting of black carbon (BC) emissions. On a voluntarily basis, Norway has reported BC annually under the Convention on Long-range Transboundary Air Pollution (LRTAP) and Arctic Council since 2015. 3 The methodology for emissions estimation was published by Statistics Norway in 2013. 4 BC is emitted by incomplete combustion from fossil fuels, biofuels, and biomass. BC is always co-emitted with organic carbon (OC). While BC warms the climate, emissions of OC have a cooling effect. The emissions are primarily estimated based on shares of BC and OC of fine particulate matter (PM2.5). In addition, other warming and cooling climate forcers like CO 2 and SO 2 , are co-emitted with BC. The Norwegian Environment Agency has assessed mitigation measures both in the short- and long term as well as health effects. 5 6 The emissions of black carbon amounted to approximately 3,100 metric tons in 2022, a reduction of 40 per cent since 1990 (Figure 1.3). The long-term reduction is primarily due to a decrease in emissions from residential stationary plants, heavy duty vehicles and buses and venting and flaring (oil and gas).
Figur 1.3 Emissions of black carbon in Norway (kilotonnes)
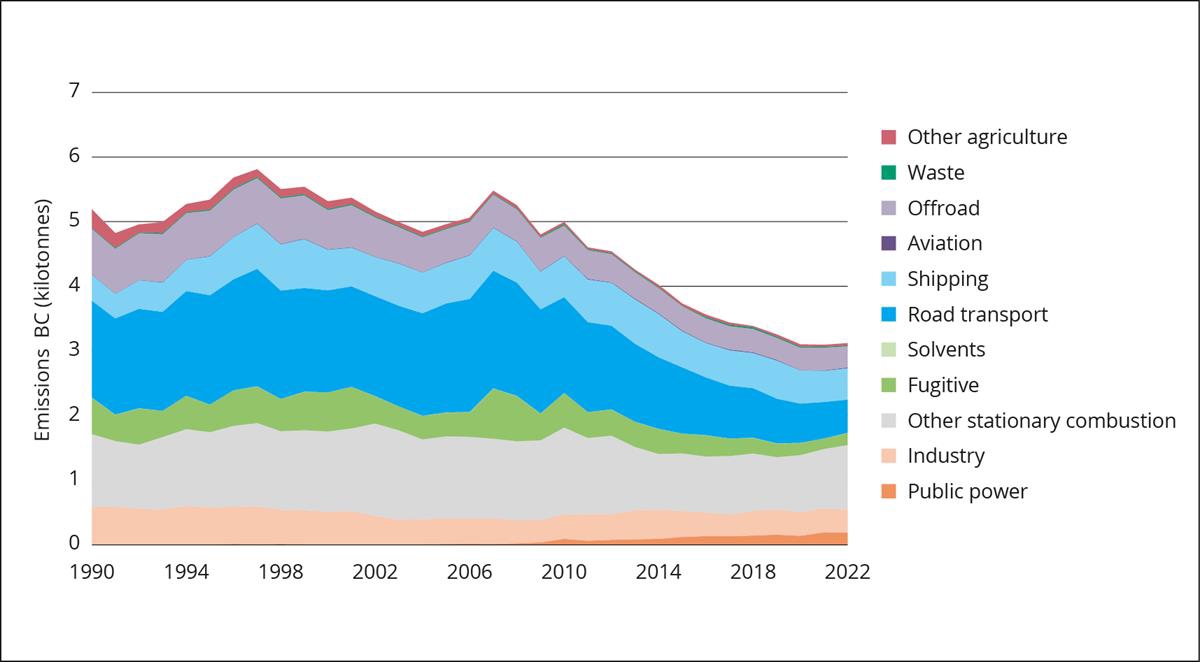
Source: Norway’s reporting to the UNECE in 2024
In 2022, the largest emission source was wood combustion in private households (other stationary combustions in Figure 1.3). Emissions have been reduced by 12 per cent since 1990. Wood burning increased significantly between 2020 and 2022 because of high electricity prices. The second most important emission source sector was Road transport. The most prominent sources within this sector are light duty vehicles, followed by passenger cars and heavy-duty vehicles and buses. Emissions in the Road Transport sector have been reduced by 9 per cent since 1990. National navigation (shipping in Figure 1.3) was the third most important emission source. Emissions have fluctuated throughout the period but reached a peak in 1998. Emissions from national navigation in 2022 were 22 per cent higher than in 1990.